An Experimental Investigation of the Plasticating and Friction Behavior of Pet Chips
Eldridge M Mount III
EMMOUNT Technologies, LLC
Canandaigua, NYAbstract
An experimental study of the plasticating and
frictional behavior of dried and preheated PET chips
on a moving, steel surface has been conducted using
an experimental apparatus called the Screw
Simulator. The Screw Simulator has been
specifically designed to reproduce the primary
plasticating [melting] and solid conveying
mechanisms of single screw extruders. The screw
simulator permits the direct observation and
measurement of a materials melting and frictional
properties. The PET resin plasticating and frictional
properties were studied as a function of metal surface
temperature, surface velocity, sample width and
applied load. In addition the materials bulk density as
a function of pressure at several preheating
temperatures was measured. These experimental
findings have important implications in the design
and scale up of single screw designs.
Introduction
Melting within an extruder was for many years an
unknown mechanism. It was not until the pioneering
screw freezing experiments of Bruce Maddock
1 that
the standard mechanism of single screw melting was
described [Figure 1]. Once the melting mechanism
was understood there was an explosion of modeling
work to solve the melting problem for use in screw
design calculations
2, 3, 4, 5. The difficulty with the
initial melting models was that there was no
independent way to check the accuracy of the
assumptions and the subsequent melting rate
calculations. All of the models were checked by
estimating the overall performance of the extruder,
which combined the assumptions of an extrusion
model [solids conveying, melting and metering model
combination] over laid on the assumptions of the
melting model. Consequently, the melting model
verifications were all indirect verifications leaving the
correctness of the melting model assumptions and the
accuracy of the calculations in question
6, 7.
This was the situation until the development of
the “Screw Simulator” by Chung
8
[Figure 2]. The
screw simulator is a device specifically designed to
measure the frictional forces
9
and the melting rate of
polymers
10 using the solid conveying model of
Darnell and Moll
11 and the idealized melting model
of single screw extruders [Figure 3]. Prior to the
onset of melting the polymer rubs against the barrel
surface and controls the solid conveying of the
polymer into the screw. In the idealized mechanism,
melting occurs only at the interface between the solid
plug of polymer and the barrel surface. This is the
location where the power of the motor is dissipated
by viscous drag to generate the thermal energy used
to melt the polymer in a single screw
12. The solid
plug assumption can also be replaced by a compacted
bed of pellets
13.
The screw simulator, while similar in concept to
the device of Sundstrom and Young
14 allowed direct
experimental measurements of friction and melting at
conditions typical of operating extruders. Figure 4
shows the melting polymer system as implemented
with the screw simulator. The applied load P
0 forces
the compacted solid plug of width X
0 against the
heated [Tb] moving [Vb] roll surface (the relative
velocity of the solid against the metal surface). The
solid velocity in the y-direction [Vsy] is measured
directly by the LVDT and the mass of solid melting
per unit area [Ω] is equal to the amount of melt
dragged from under the solid plug on the barrel
surface. The molten polymer layer is removed by the
scraper to mimic the action of the pushing screw
flight in the melting mechanism of Figures 1 and 3.
The screw simulator for the first time permitted the
development and verification of the assumptions and
accuracy of the various melting models for
plasticating extruders
7.
The friction and melting measurements are
important as they are used to determine the
performance and design parameters of operating extruders. The measurements confirmed for the first
time that in the limit, single screw extruders are
melting limited apparatus
15, 16. Also, they can be used
to estimate the expected output of a single screw
extruder based on the screw dimensions, details of the
screw design, polymer type and operating conditions.
In particular the measurements have been used in a
scientific screw design method described by Chung
17,
18. Melting data for screw design calculations can be
obtained either experimentally or estimated using the
melting model of Mount, Watson & Chung
8 for fully
compacted solid beds or Kuo & Chung
13 for granular solid beds.
Experimental
The Screw simulator was used to measure the
bulk density, frictional properties and the melting
properties.
The resin sample was a polyethylene
terephthalate (PET) chip of 0.60 IV. Prior to testing,
the resin sample was dried and crystallized in a
vacuum oven heated to 165
oC to 177
oC [330
oF to 350
oF].
Bulk density measurements are obtained by
introducing a weighed sample to the screw simulator
sample cell (2.54 cm by 7.62 cm), the sample plunger
is inserted and the initial sample height measured at
6.89x10
-2-1.38x10
-1 MPa [10-20 psi] with the screw
simulators LVDT to give the initial sample volume.
Pressure is increased in a stepwise fashion and the
sample volume calculated as a function of pressure to
give the sample bulk density.
Friction coefficients were obtained by:
1. Presetting the roll speed and roll
temperature
2. Preheat the chip to 83.3
oC
3. add a known weight of polymer pellets to
the sample cell
4. apply the desired load to the sample
5. allow sample/roll interface to equilibrate
6. Activate recording equipment and rotate
the roll for several seconds to obtain
applied load and frictional force.
The roll is only rotated to give an initial frictional
force as extended operation generated significant
frictional heating of the interface which affects the
measurements.
Melting experiments are performed in the
following manner:
1. The roll velocity, temperature and load
are preset before the measurement is
started
2. The recording equipment is set to
measure LVDT position and the sample
restraining force [shear stress]
3. Preheat the chip to 83.3
oC
4. A pellet sample is introduced to just fill
the sample chamber, the plunger inserted
and the load applied and allowed to
equilibrate for 10-15 seconds to compress
the sample
5. The roll rotation is started and the
melting rate measured. During the
melting measurement, the roll surface is
scraped to remove the melt layer from the
roll surface
6. The height of the solid sample is
recorded with the Screw Simulator
LVDT and plotted as a function of time
during the experiment to obtain the solid
velocity in the direction of the roll
surface (Y direction)
7. At the end of the experiment the load is
released, the roll stopped and the
recording equipment stopped.
8. The melting velocity cm/min is measured
as the slope of the LVDT position vs.
time on the strip chart recording, the
melting shear stress is determined from
the measured sample chamber restraining
force.
Melting rate, Ω [kg/min/cm
2] is calculated as the
product of the solid velocity [cm/min] measured as
the slope of the LVDT chart recording and the pellet
bulk density (gm/cm
3) at the load applied to the
sample.
Melt viscosity was measured as a function of
temperature and shear rate using an Instron 3211
capillary rheometer. Temperatures were 260
oC, 270
o
C, 280
oC, 290
oC and 300
oC. Data was obtained
using a 0.1275 cm [0.0502 in] diameter by 7.623 cm
[3.0037in] 59 L/D long capillary with a 90 degree
entry angle. Prior to the viscosity measurements, the
pellet samples were dried for 9 hours in vacuum at
165
oC. Because the PET melt viscosity is Newtonian, the apparent viscosity is presented and
the data was not Rabinowitsch corrected.
Experimental conditions of surface temperature,
sliding velocity and applied load were varied one
variable at a time while maintaining the other two at a
constant value. For the friction measurements, the
applied load, P
0, was help at 6.89MPa (1000 psi) as
representative of most expectations for solid
conveying pressures. For the melting experiments an
applied load of 2.76MPa (400 psi) was selected as
representative of the pressure where the equilibrium
melting rate was observed. The sliding velocity of
55.9 cm/sec was chosen as representative of a 114.4
mm diameter screw, rotating at a screw speed of 93.4
rpm. For the friction experiments, a surface
temperature of 121
oC, as representative of a feed
zone temperature, and for the melting experiments, a
surface temperature of 276
oC and 293
oC, as
representative of melting and metering barrel zone
temperatures were used.
Calculations
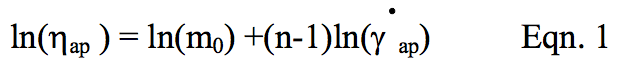
The viscosity data is plotted in Figure 1 and was
curve fit to Equation 1. The regression results are
found in Table 1.
The bulk density was calculated for the
compressed solid volume and the initial weight of the
sample. The data is plotted in Figure 2 and was curve
fit to Equation 2. The regression coefficients are
listed in Table 2.

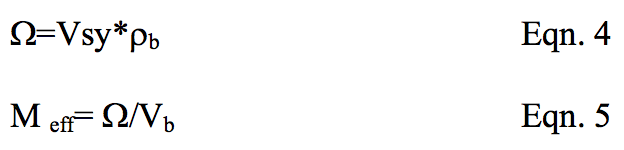
The melting and frictional data were obtained as
described and the experimental data used to calculate
the frictional coefficient [Equation 3] and the solid
melting velocity, V
sy in the Y-direction [Equation 4].
The melting rate Ω (kg/sec/cm) and the Melting
efficiency Ω/V
b (kg/cm
2-cm), are calculated with
Equations 4&5. The melting efficiency has units of
density but are better understood if they are expressed
as mass melted per unit area per unit distance slid or
gm/cm
2-cm.

For calculations based on the Mount et al Model,
the dimensionless melting efficiency is described as
[Equation 6]

Results and Discussion
Figure 5 presents the bulk density data as a
function of pressure and chip preheating temperature.
It is clear that the preheat temperature used to dry the
chips has an impact on the solids bed compaction.
Preheat temperature will also have an impact on
melting rate as it decreases the energy required to
raise the solid to the melting point. Consequently, it
is important to maintain the chip temperature as high
as practical when transporting it from the chip drier to
the extruder feed pocket. In the case at hand the chip
was expected to drop in temperature from 166°C at
the exit of the drier to 83°C at the extruder feed
hopper. Consequently, the friction and melting
measurements were preformed with a solid
temperature of 83°C.
Figures 6, 7 and 8 presents the Solid frictional
coefficient (COF) data obtained as a function of metal
surface temperature [T
b], Roll surface velocity [V
b]
and applied load [P
0].
In Figure 6 the COF is seen to be a weak function
of surface temperature for a sliding velocity of 55.9
cm/sec and an applied load of 0.145 Pa. At
approximately 175°C the solid is observed to grind
[fine, white, powdery pieces of polymer adhered to
the roll surface] indicating the beginning of
mechanical melting [plastication]. At a surface
temperature of 190°C and 207°C the sample is
observed to be melting (filled circles) with a distinct
melt film on the roll surface, indicating an interfacial
temperature of greater than the melting point of
approximately 260°C.
In Figure 7, the COF remains fairly constant for
sliding speeds below 80 cm/sec and then jumps
slightly. This is likely due to the increased heat
generation at higher sliding speeds and indicates the
potential for a change in solids conveying rate at increased screw speeds. Operating at screw speeds
near the 80-85 cm/sec transition could potentially
cause surging in systems where the screw speed is
controlled by a device such as a melt pump. For
constant screw speed operation a jump in feeding
would be expected for screw speeds above 85 cm/sec
peripheral speeds. This could result in an increase in
specific output or surging depending on the screw
design and operating conditions. At any rate the
observed jump in COF is important to note.
Figure 8 plots the COF as a function of applied
load. The COF is seen to remain fairly constant with
increasing pressure. At a pressure of 0.06 Pa there is
a slight jump in COF. This might be due to packing
variations of the pellets but no real explanation of the
observation can be given.
In all instances after the frictional measurements,
observations of the preheated chip samples at the
polymer/metal interface showed a void free interface
indicating that the sold bed deformed sufficiently to
completely contact the metal surface. At the
polymer/metal interface, the solid bed is behaving
like a solid plug.
Figures 9, 10 and 11 present the plasticating
efficiency as function of metal surface temperature
[T
b], Roll surface velocity [V
b] and applied load [P
0]respectively.
Figure 9 Plots the melting efficiency vs. surface
temperature [T
b] for a solid temperature of 83.3°C, an
applied load of 0.145 Pa (1000 psi) and a surface
velocity of 55.9 cm/sec. The plot shows a slight
maximum around 275-280°C and would drop sharply
for surface temperatures below 250°C to the onset of
melting seen in Figure 6 at about 200°C. The melting
rate drops above 275-280°C due to the decrease in
melt film viscosity and melting stress [Figure 12] and
a subsequent drop in viscous dissipation in the melt
film. Consequently, there is no advantage to
increasing the barrel temperatures much above 270-
275°C unless the extruder is torque limited.
Figure 10 plots the melting efficiency vs. surface
velocity [V
b] for a solid temperature of 83.3°C, an
applied load of 2.76MPa (400 psi) and surface
Temperatures of 276°C and 293°C. The plot show a
marked decrease in kg/cm
2-cm slid and is indicative
of a decrease in melting efficiency, not melting rate,
with increasing screw speed. What this means is that as the sliding speed is increased, while more polymer
is melted per cm
2, less is melted per cm slid. This is
because while more energy might be dissipated in the
melt film under the melting solid, less of the energy
has time to diffuse to the melting interface and is
swept into the accumulating melt pool. This is why
melt temperature and torque increases with screw
speed.
Figure 11 plots the Melting efficiency vs. applied
load for a solid temperature of 83.3°C, a surface
velocity of 55.9 cm/sec and a surface Temperatures
of 296°C. The melting efficiency is seen to increase
up to approximately 2.76MPa (400 psi) and reach a
constant value. This is likely due to thinning of the
melt film with increasing load to the point where the
solid bed is sufficiently compacted to form a “solid”
interface at the melting surface, limiting melt
penetration into the solid bed. It indicates that for
solids conveying pressures above 0.058 Pa the
melting process will be in equilibrium with the solids
conveying forces. Solids conveying forces higher
than 0.058 Pa will not benefit melting and may only
result in increased screw wear.
Figure 12 Plots the viscous stress vs. Surface
temperature for a solid temperature of 83.3°C, an applied
load of 6.89 MPa (1000 psi) and a surface velocity of 55.9
cm/sec. the viscous stress is seen to peak at approximately
275-280°C and then drop at approximately 285°C to a
constant value above 290°C. This matches well the
observed melting efficiency changes seen in Figure 9
and demonstrates the decrease in viscous dissipation
above 285°C leading to the decrease in melting
efficiency above 285°C.
Figure 13 plots the viscous stress vs. surface
velocity [V
b] for a solid temperature of 83.3°C, an
applied load of 2.76MPa (400 psi) and surface
Temperatures of 276°C and 293°C. The viscous
stress is seen to reach a maximum or slowly
increasing stress above approximately 60 cm/sec,
perhaps indicating the formation of an equilibrium or
limiting melt film thickness. The limiting stress
value corresponds to the decrease in melting
efficiency observed in Figure 10.
Conclusions:
The experimental observations of the melting
performance of 0.6 IV PET pellets highlight the basic
frictional and melting behavior of the polymer. The data can be used to help optimize the performance of
PET screw designs for estimating output levels and
highlighting limiting behaviors as a function of
process settings. For instance, the impact of surface
temperature and sliding velocity, on COF and melting
efficiency, as well as highlighting transition points
such as the sudden increase in COF with temperature,
the maximum in melting rate with surface
temperature. This information can be used to set
optimum barrel temperature settings and screw
speeds for solids conveying and melting and avoid
settings which might result in extrusion instabilities.
References
1. Maddock, B. H.,”A Visual Analysis of Flow and
Mixing in Extruder Screws”, SPE Journal, May,
(1959), pp. 383-389
2. Tadmor, Z., “Fundamental Of Plasticating
Extrusion”, Poly. Eng. Sci., 6(3), 185 (1966)
3. Tadmor, Z, Duvdevani, I., Klein, I., “Melting in
Plasticating Extruders Theory and Experiments”,
Poly Eng & Sci,7, (1967), 198
4. Donovan, R. C., Polym. Eng. Science, 12(1), 59
(1972)
5. Chung, C. I., “A New Theory for Single-Screw
Extrusion,” Part 1 - Modern Plastics, 45(13), 178
(1968); Part 2 - Modern Plastics, 45(16), 110
(1968).
6. Chung, C.I., “Plasticating Single-Screw Extrusion
Theory,” Poly. Eng. Sci., 11(2), 93 (1971)
7. Mount III, E. M., “Plasticating Behavior of Solid
Polymers at Processing Conditions: Experimental
and Theoretical Study”, Ph.D. Thesis, Rensselaer
Polytechnic Inst., Troy NY (1978)
8. Chung, C.I., “A New Look at the Melting
Mechanism,” Plastics Eng., 32(6), 1149 (1976)
9. Chung, C.I., Hennessey, W. and Tusim,M.
“Frictional Behavior of Solid Polymers on Metal
Surfaces at Processing Conditions”, Poly. Eng.
Sci. , 17(1), 9 (1977).
10. Mount III, E.M., Chung, C.I. , “Melting Behavior
of Solid Polymers on Metal Surface at Processing
Conditions,” with Poly. Eng. Sci., 18(9), 711
(1978).
11. Darnell, W.H. and Mol, E.A.J., SPE Journal, 12,
20 (1956)
12. Chung, C. I., Mount III, E.M. and McClelland,
D.E., “Energy Efficiency in Plasticating Screw
Extrusion,” with, ACS-Organic Coatings and
Plastics Chemistry Preprint, 39, 74 (1978)
13. Chung, C.I., Kuo, S.H. “Analytical Melting
Model for Polymer Pellets,”, Poly. Eng. Sci.,
29(7), 448(1989)
14. Sundstrom, D.H., and Young, Chi-Chang, Polym.
Eng. Sci., 12, 59-63, (1972)
15. “On the Scale Up of Plasticating Extruder
Screws,” Poly. Eng. Sci., 24(9), 626 (1984).
16. Chung, C.I, EXTRUSION OF POLYMERS -
Theory and Practice 2nd edition, Carl Hanser
Publisher, Munich, 2010, p. 239
17. Chung, C.I., “Science and the Art of Screw
Design,” Proceedings of the Summer Meeting,
Polymer Processing Society, 11D (1989)
18. Chung, C.I., “A Scientific Approach to Screw
Design,” SPE-ANTEC Technical Papers, 43, pp
121–126 (1997).
Tables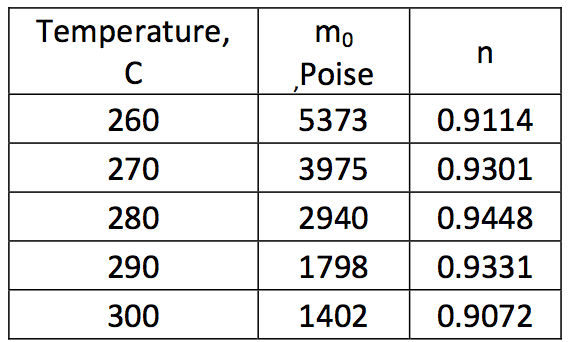
Table 1: Viscosity data regression coefficients for Equation 1 with viscosity in poise. To convert poise to Pa-sec, divide result by 10
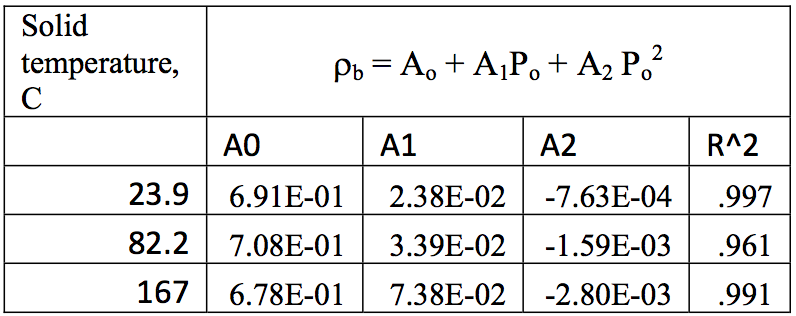
Table 2: Regression coefficients for bulk density [gm/cm
3] as a function of pressure [MPa]
Figures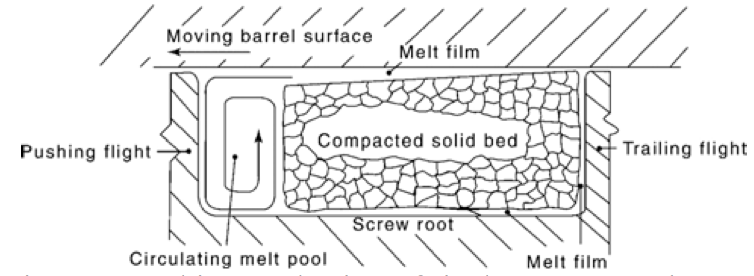
Figure 1: Melting mechanism of single screw extruders as determined by Maddock.
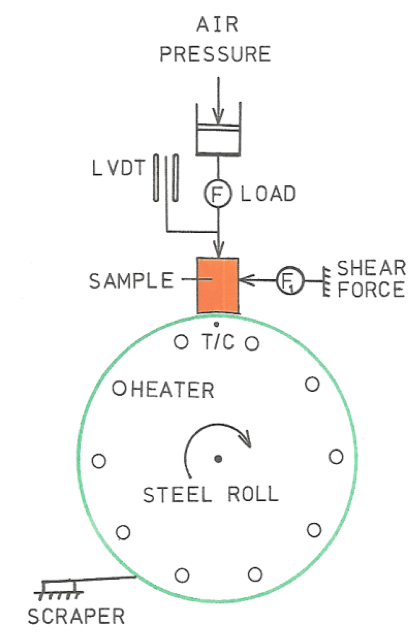
Figure 2: Schematic diagram of the screw simulator
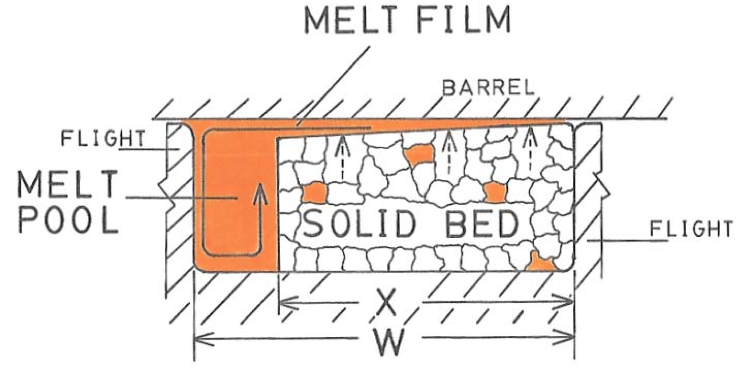
Figure 3: Idealized melting mechanism of single screw extruders assuming melting only at the barrel surface.
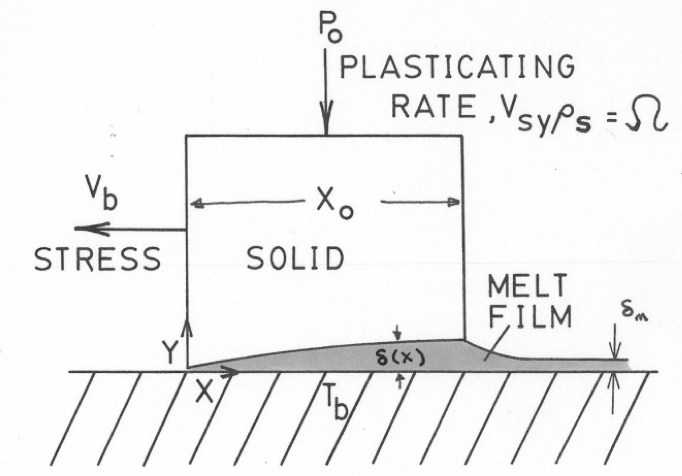
Figure 4: Mass balance around melting solid plug at the barrel surface
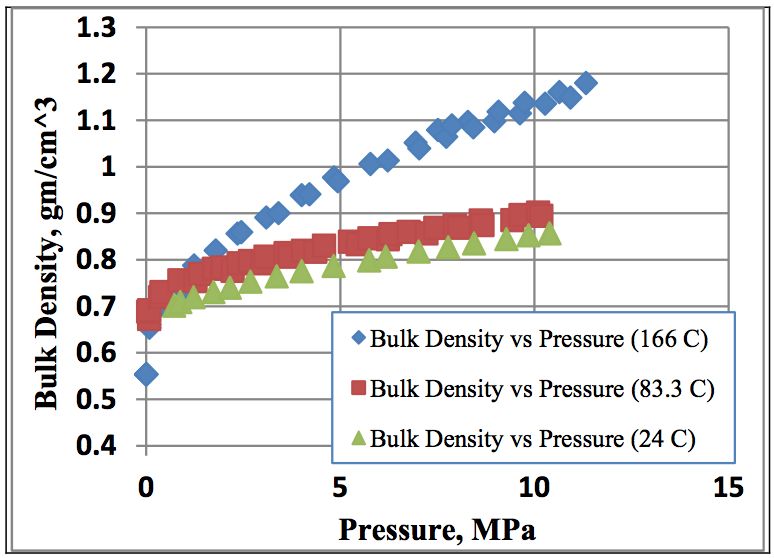
Figure 5: Bulk density vs. pressure for PET chip at various solid preheat temperatures
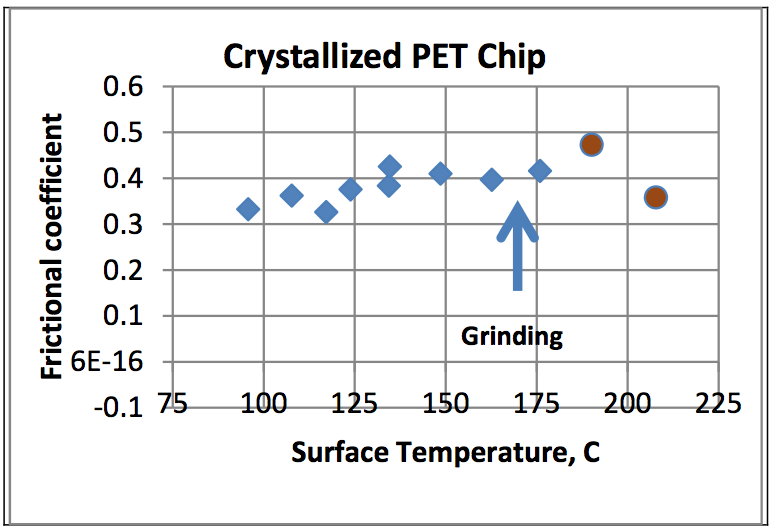
Figure 6: Plot of Frictional coefficient vs. surface temperature [T
b] for a solid temperature of 83.3
oC, an applied load of 6.89MPa (1000 psi) and a surface velocity of 55.9 cm/sec. The sample was observed to grind at 175
oC and the onset of plastication (circles) was observed above 190
oC (melting point is approximately 265
oC)
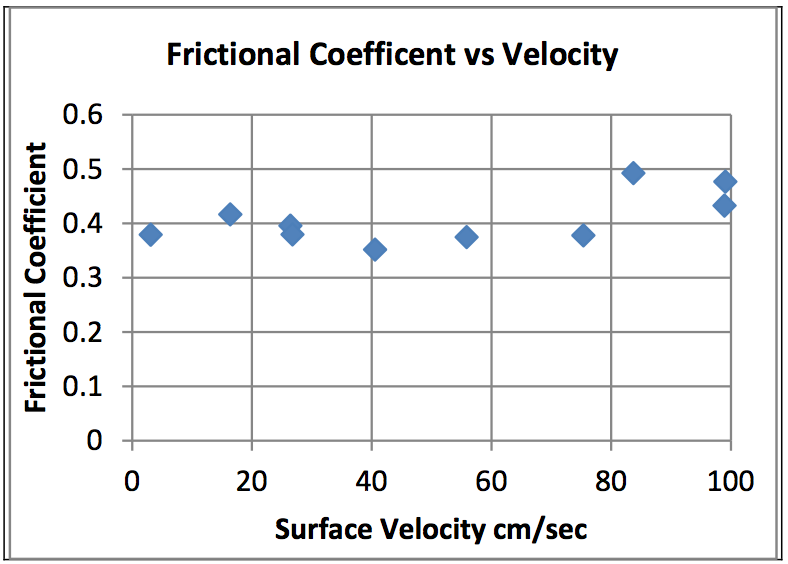
Figure 7: Frictional coefficient vs. surface velocity [V
b] at a preheat temperature of 83.3
oC, a surface temperature of 121
oC and an applied load of 6.89 MPa (1000 psi).
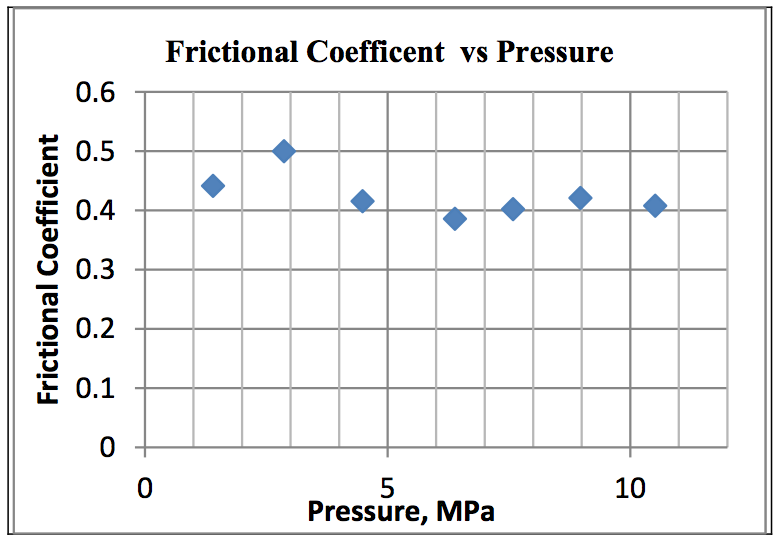
Figure 8: Frictional coefficient vs. applied load [P
0] at a preheat temperature of 83.3
oC, a surface temperature of 121
oC and an surface velocity of 55.9 cm/sec
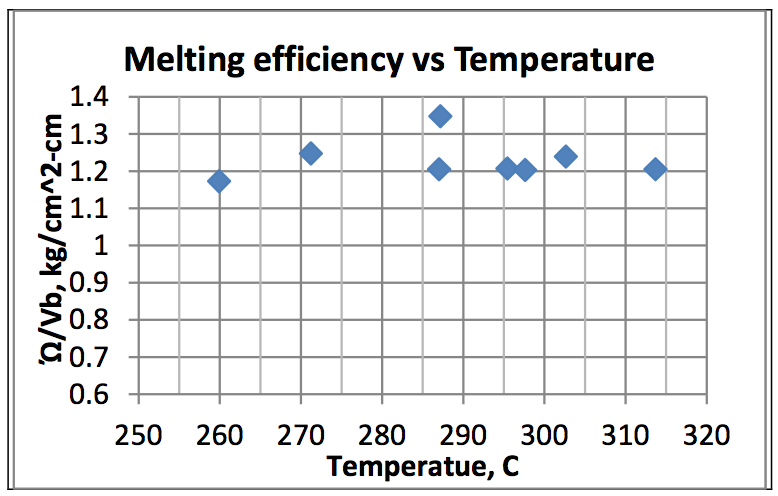
Figure 9: Plot of melting efficiency vs. surface temperature [T
b] for a solid temperature of 83.3
oC, an applied load of 6.89MPa (1000 psi) and a surface velocity of 55.9 cm/sec.
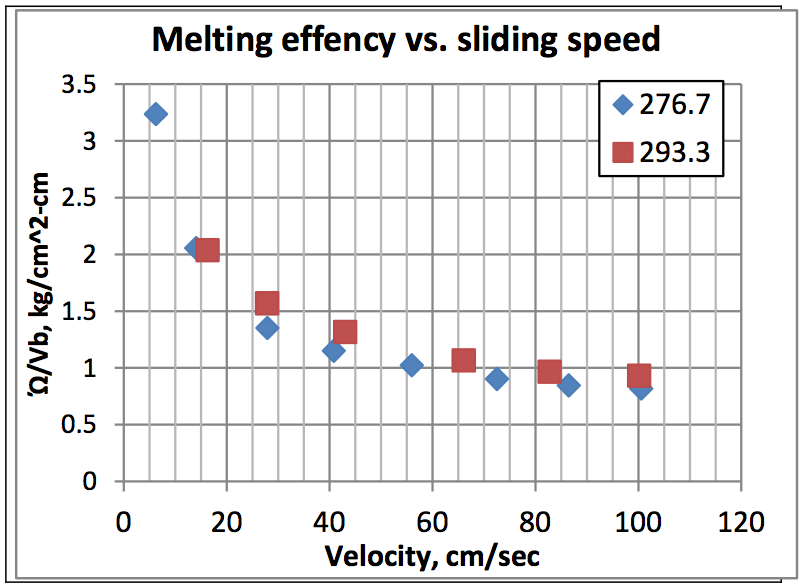
Figure 10: Plot of melting efficiency vs. surface velocity [V
b] for a solid temperature of 83.3
oC, an applied load of 2.76MPa (400 psi) and surface Temperatures of 276
oC and 293
oC.
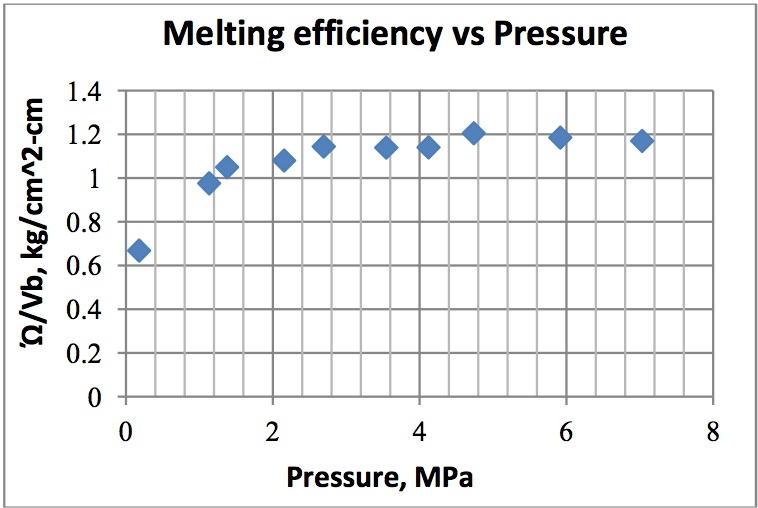
Figure 11: Plot of Melting efficiency vs. applied load for a solid temperature of 83.3
oC, a surface velocity of 55.9 cm/sec and a surface Temperatures of 296
oC.
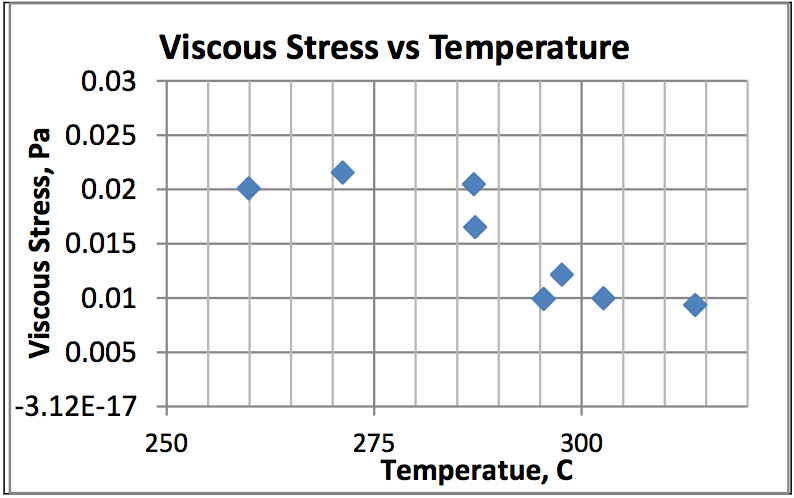
Figure 12: Plot of viscous stress Vs. Surface temperature for a solid temperature of 83.3
oC, an applied load of 6.89 MPa (1000 psi) and a surface velocity of 55.9 cm/sec.
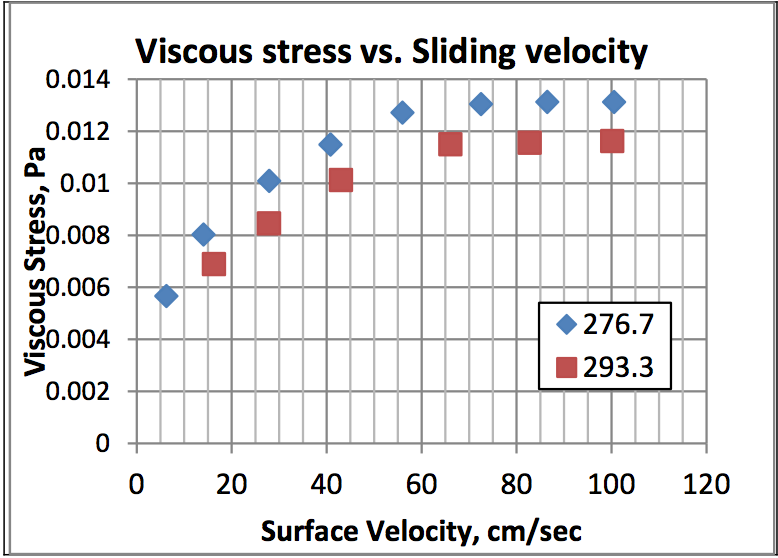
Figure 13: Plot of viscous stress vs. surface velocity [V
b] for a solid temperature of 83.3
oC, an applied load of 2.76MPa (400 psi) and surface Temperatures of 276
oC and 293
oC.
Return to
Paper of the Month.