A Mechanism for Solid Bed Breakup in Single-Screw Extruders - Solid Bed Shape Change
Gregory A. Campbell, Clarkson University/Castle Associates, Jonesport, ME
Mark A. Spalding, The Dow Chemical Company, Midland, MIAbstract
It is well known that solid bed breakup in plasticating
single-screw extruders can lead to defects in the
downstream product, reduced rates, and process
instabilities. After a review of the mechanism of solid bed
melting an enhanced discussion will be presented
regarding a new concept for solid bed break up. The
literature generally attributes this breakup to pressure
gradients emanating from the beginning of the metering
section of the screw. In a previous paper [1] a new
mechanism was proposed that was developed as a result of
the physics of the melting mechanism and fluid flows
associated with screw rotation physics. During the
discussion after the presentation of this new mechanism at
ANTEC 2013, questions were raised as to the assumptions
made regarding the shape change of the solid bed during
melting which the authors proposed was a result of the
flow that occurs as a result of the new mechanism. In this
paper more data will be presented that will help define this
new concept.
Introduction
Solid bed breakup is a process that occurs in almost all
plasticating single-screw extruders, and in most cases the
process is undesirable since it can lead to solid polymer
fragments in the extrudate, process instabilities due to
solids plugging mixers, and thermal gradients [2]. Solid
fragments in the extrudate will almost always cause defects
in the finished product. For example, a lab extruder was
operated with a mixture of 100 parts of white tinted
acrylonitile-butadiene-styrene (ABS) terpolymer pellets
with 1 part of black tinted ABS pellets. If the extruder
operates properly without solid bed breakup, the extrudates
are tinted black and are relatively uniform in color, as
indicated by the cross sections shown in Figure 1 at screw
speeds less than about 70 rpm. At higher screw speeds, the
solid bed broke up and caused solid polymer fragments to
flow downstream and into the extrudate, as indicated by
the white tinted fragments at screw speeds greater than 80
rpm.
Solid bed breakup can be observed by performing a
Maddock solidification experiment [3], as indicated by the
photographs in Figure 2. Here the black tinted areas show
regions in the screw channels that were molten at the
moment of stopping screw rotation and solidifying the
resin. Areas that were tinted white show regions that contain resin in the solid form. Solid bed breakup is
evident in these cross sectional photographs since there are
regions were the molten resin is essentially across the
entire channel and solids are evident in downstream cross
sections. These types of views are typical in almost all
published Maddock solidification experiments.
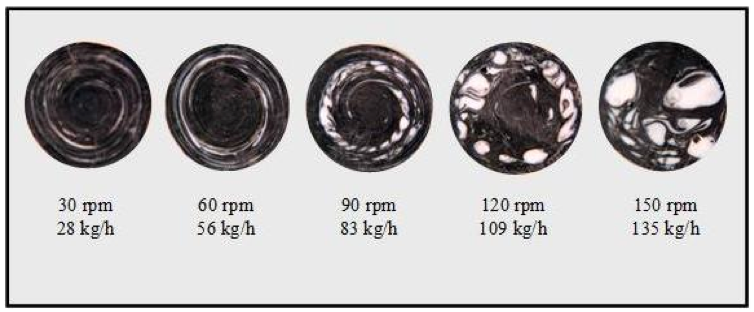
Figure 1. Cross-sectional views of extrudate samples at a letdown ratio of 100 to 1 of a white pigmented ABS resin with a black color concentrate for a melting-mixing experiment.
Literature references discuss solid bed breakup as a
phenomenon where strong forces due to pressure gradients
breakup the low strength solid bed [4,5]. The source of the
pressure gradients, however, is not evident and in general
the pressure is higher at the end of the bed so this would
logically tend to push the particles back into the bed. Zhu
et al. constructed an extruder with glass inserts in the barrel
for viewing the internal processes during extrusion [6] and
injection molding [7]. Their observations indicated that
solid bed breakup was more likely to occur at high screw
speeds. For injection molding plasticators, bed breakup is
more likely to occur for long injection strokes, high
discharge pressure (back pressure), and long dwell times
[7]. They observed small cracks that occurred across the
solid bed and perpendicular to the flights in the later stages
of the melting process. These cracks would then increase in
width as they were filled with molten polymer. Their
observations are consistent with previous researchers. The
mechanism for the crack formation was not reported.
The current melting and conveying mechanisms using
barrel rotation physics do not provide an explanation for
solid bed breakup. Screw rotation physics, however,
provides a melting mechanism and a flow mechanism that
explains the solid bed breakup process in single-screw
extruders.
Melting Mechanism Literature
The key to understanding solid bed breakup is the
comprehension of the melting mechanism that occurs in
the extruder using the actual boundary conditions for screw
rotation physics. Therefore this relatively new melting
mechanism will be outlined and reviewed in this section.
Recently the Polymer Processing Research group at
Clarkson University reexamined the melting data published
in Tadmor and Klein [4] and found that in essentially all
cases the material in a conventional screw transition
section disappeared in the height direction before the width
direction, as shown in the reanalysis of the data in Figure
3. This was in direct contrast from the melting theory
developed by Maddock [3] and the model developed by
Tadmor and Klein [4]. The Tadmor and Klein model had
the solid bed disappearing in the width direction only.
Lindt and his research group investigated and reported a
body of work trying to set up a series of complete
mathematical models for the melting process. Lindt [11]
developed a model by considering the solid bed in the
center of the cross-section in 1976 using barrel rotation
theory. Lindt focused his later work on the five-zone
melting model [12-15]. Lindt, Elbirli, Gottgatreu, and Baba
[12] set up a model by considering all situations that
previous people considered separately. Lindt and Elbirli
[13] considered the cross section circulation in the model
in 1985 where the screw was still considered to be
stationary. Also in 1985, Lindt claimed that "the
development of the melting theory based on the Maddock
mechanism has been virtually completed" [14].
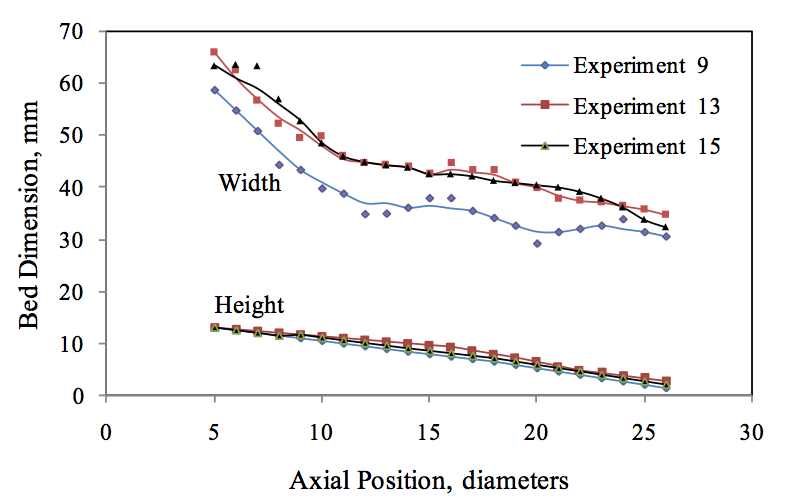
Figure 3. Reevaluation of the melting data from Tadmor and Klein for PE resins [4] as analyzed by Tang [8] and Campbell et al. [9,10].
A new melting mechanism was developed using screw
rotation physics that is diagrammatically portrayed in
Figure 4. The rotation of the screw creates a velocity
gradient at the barrel-solid bed interface and the combination of the heat flux from the barrel and the
dissipation in Film C cause the solid to melt in the negative
y direction. The motion of the screw under the bed
contributed to the energy dissipation in Film D, causing the
bed to melt in the positive y direction. The same
mechanisms occur in Zones E and B to melt the solid bed
in the x directions. A major difference in this mechanism
compared to the historic literature analysis is that the bed
does not reorganize.
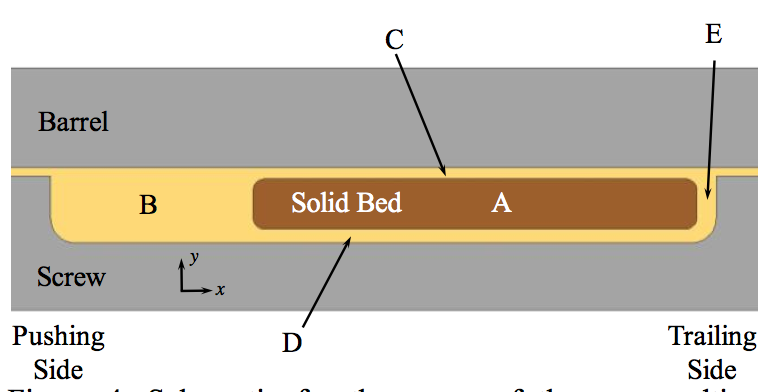
Figure 4. Schematic for the zones of the new melting concept: Zone B is the melt pool, Zone C is the melt film located between the solid bed and the barrel wall, Zone D is the melt film between the solid bed and the screw root, and Zone E is the melt film between the solid bed and the trailing flight. The cream color represents molten resin.
The Tadmor and Klein model [4] allows melting only
in the Zone C film located between the solid bed and the
barrel wall, as shown in Figure 4. The material melted is
then dragged by the motion of the barrel and collected in
the melt pool of Zone B. As melting progresses, the melt
pool increases in width and the solid bed decreases in
width. The solid bed is assumed to reorganize such that it
covers the full depth of the channel. Near the end of
melting, the Tadmor melting model and other literature
models have the last remaining portion of the solid bed
positioned at the trailing flight and across the full depth of
the channel, as shown by Figure 5a. These models are all
based on barrel rotation physics.
As previously mentioned, the Tadmor and Klein
model forces all melting to occur in Zone C. The melting
that occurs at the other zone interfaces with the solid bed is
ignored because the velocity gradients and thus energy
dissipations were believed to be very small. These
gradients are due to the solid bed moving at a velocity Vsz
calculated from a mass balance at the entry to the melting
section and a stationary screw; i.e., barrel rotation physics.
Recently Campbell, Spalding, and Tang [16,17] have
reexamined the assumptions in the literature models in
order to address the reanalysis of the classical melting data
discussed previously and shown in Figure 3. This concept
was developed based on recognizing that the rate limiting melting dynamics for solid bed consumption was in the
channel height and not the channel width direction. Here
the melting process occurs in all four of the melt films
surrounding the solid bed, as shown in Figure 4. The
boundary conditions were set to those for screw rotation
physics.
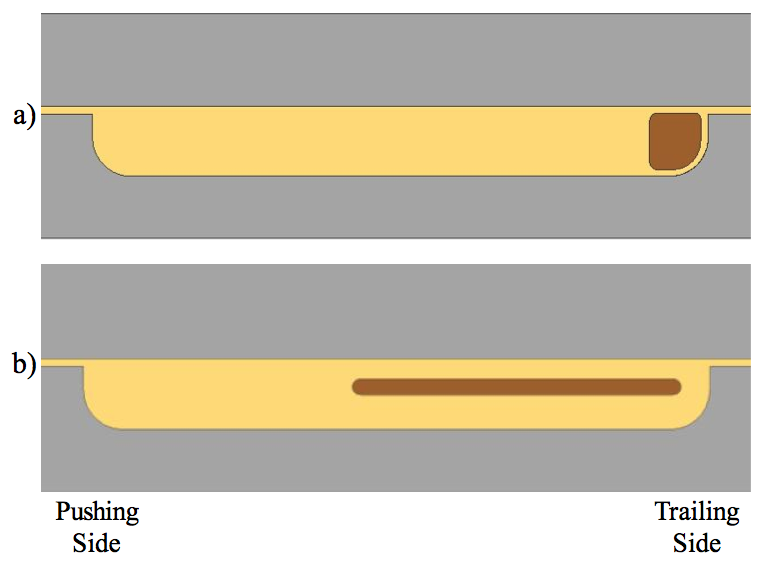
Figure 5. Schematics of the solid bed just prior to complete melting: a) the solid bed is pushed to the trailing flight with the Tadmor melting model and barrel rotation physics, and b) the solid bed is a thin plate and positioned as in the diagram (screw rotation and observation). The cream color represents molten resin.
To visualize the difference between screw rotation and
barrel rotation, a simple cardboard paper towel roller can
be used to model the screw core and a wood block to
model the solid plug. For barrel rotation, the roller is held
constant and the block is moved downstream at a velocity
of V
sz. Here the velocity difference between the block and
roller is simply V
sz. For screw rotation, the roller is rotated
counterclockwise while the block is moved downstream
with a velocity of V
sz. The observer will see that the core of
the screw is moving in the negative z (helical) direction at
a velocity of V
cz. The velocity difference for Zone D is as
follows:
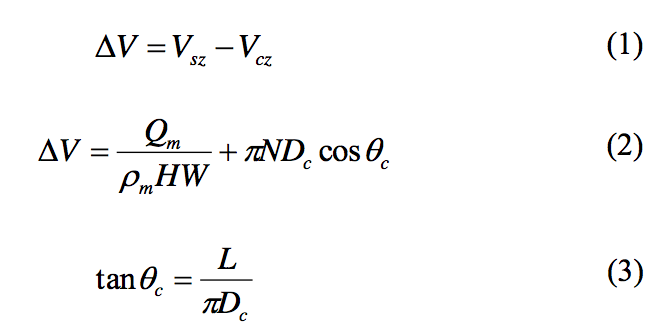
where ΔV is the velocity difference between the solid bed
and the root of the screw, Q
m is the mass flow rate, ρ
m is
the bulk density of the solids at the start of melting, H is
the channel depth at the start of melting, W is the average
channel width, N is the rotation rate of the screw (rev/s), D
c
is the diameter of the screw at the root (or core), θc is the
helix angle at the screw root, and L is the lead length. The
first term on the right side of Equation (2) is V
sz while the
second term is –V
cz. A schematic of the velocity difference
is provided in Figure 7. This velocity difference is
considerably larger than that for barrel rotation physics.
The screw rotation model presented here includes the
dissipation and melting rates for all zones. The details may
be found in [2].
Developing a physical model for these melt zones,
leads to a description of the flow dynamics in the films that
exist in the screw channel from the beginning of the
melting of the solid bed through the transition section that
ends at the beginning of the metering section. A schematic
of a typical solid bed profile is provided in Figure 6 with
the solids profile near the end of melting shown in Figure
5b for screw rotation. The fluid velocity gradient in Film C
at the top of the solid bed is in the x direction which causes
fluid to be deposited into Zone B. The fluid velocity in
Film D between the screw root and the solid bed in Figure
4 is a more complex recirculation flow due to motion of
the screw surface in the opposite direction of the solid bed.
That is, the screw root motion drags fluid into the Film D
gap at the end of the transition section. Some of the fluid
that is dragged into Film D is thought to flow into Zone B
due to a higher pressure under the solid bed than in the
melt pool (Zone B). This pressure under the solid bed is a
key to the mechanism for solid bed breakup.
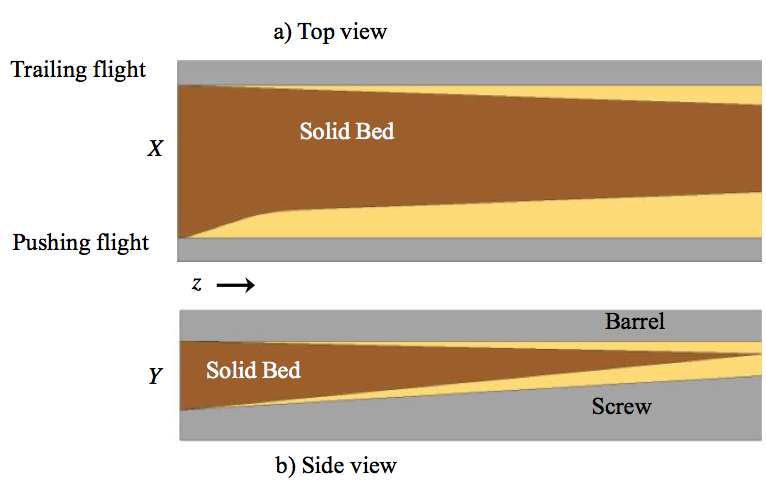
Figure 6. Qualitative shape of X and Y bed dimensions and
melt film thickness for melting in a conventional transition section; a) top view, and b) side view. The cream color represents molten resin. Here X and Y are the local width and thickness of the solid bed, respectively.
For most extrusion processes, the solid bed can
breakup near the completion of melting, that is in the
transition as it approaches the metering section. At this
point in the melting process the bed is relatively thin and
its cohesive strength is low. The strength of the bed is low
at this location since the solid bed temperature is
approaching the melting temperature or devitrification
temperature and thus the material modulus is low. Because
the bed is thin in the y direction there is little stability.
Evidence of solid bed breakup is apparent in photographs
of Figure 2. Moreover, solid bed breakup is evident in
almost all reported Maddock solidification experiments for
a conventional melting screw. The initiation of the breakup
may be the result of the physics discussed previously from
references [6,7].
The Mechanism for Solid Bed Breakup
As will be presented next, two processes are required
for solid bed breakup. These processes include the melting
mechanism presented above for screw rotation physics and
a flow mechanism for transporting molten resin between
the solid bed and the screw root.
It is obvious that the strength of the solid bed would be
low near the end of melting since the bed is very thin and
its temperature is approaching the melting or
devitrification temperature. Based on the historical melting
models using barrel rotation physics, the pressure gradients
postulated for breaking the bed are difficult to produce. In
general, the pressure gradient in the transition section is
positive such that one might speculate that this would
stabilize the bed by pushing the solids back toward the
thicker and more stable portion of the bed. However, screw
rotation theory leads to an alternative mechanism to those
based on barrel rotation theory. Screw rotation theory is
presented in great detail in [2,18-22] for the metering
section. For screw rotation analysis, the barrel has zero
velocity and the solid bed is moving in the positive z
direction at a velocity of V
sz. The screw has a velocity of
–V
c and a component in the z direction of -V
cz. Here, the
backward motion of the screw (ǀ-V
czǀ or V
cz) is larger than
Vsz, causing a negative pressure gradient (∂P/∂z) in Film D
between the solid bed and the screw root.
There has not been an extensive technical discussion
as to why the solid bed always is in close proximity to the
barrel. It is thought that centrifugal force is not the primary
mechanism because this phenomenon is prevalent even at
very low screw rotation speeds. The locally higher pressure
resulting from the rotation of the screw under the solid bed
in Film D of Figure 7 is postulated to force the solid bed up
against the barrel surface. This would explain the
consistent observation that the solid bed is always near the
barrel surface with only a thin film of fluid between the
barrel and the solid bed that results from melting at the
barrel-solid interface. There can be a substantial thickness
of melt in Zone D. The pressure in Film C has been
experimentally measured by many researchers. The local
pressure in Film C is always less than the pressure in the
melt pool. With the local pressure in Film C being less than
that in the melt pool and with the pressure in Film D higher
than the melt pool, it follows that the difference in the
pressures create a force that pushes the solid bed against
the barrel wall.
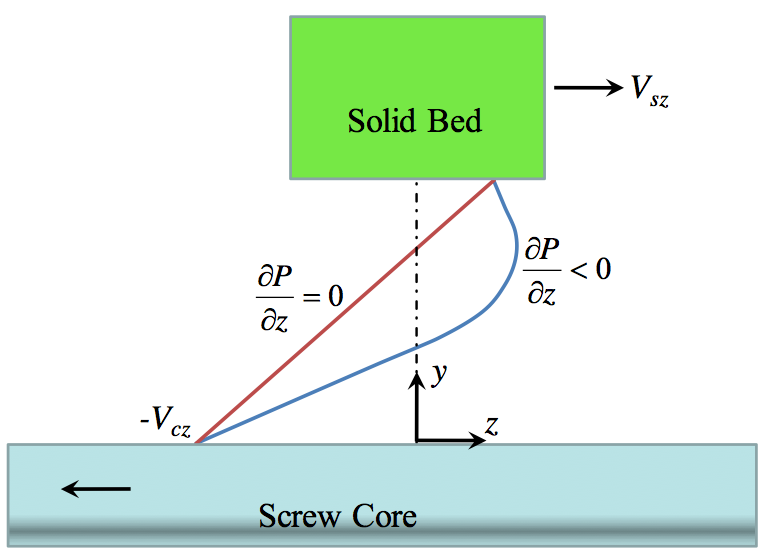
Figure 7. Schematic of the Vz velocity in the Film D between the screw core and the solid bed. The red and blue velocity lines are for pressure gradients that are zero and negative, respectively. The dotted vertical line is for Vz = 0.
The existence of a fluid flow back toward the solid
feeding section is postulated as seen in Figure 7. For a
typical melting system the pressure under the bed was
calculated and is presented in Figure 8 if there were no
leakage flow from Film D to the melt pool. One observes
that the predicted pressure at the beginning of the melting
is extremely high and well above that which is measured.
The authors than went to the literature to determine if there
is any evidence during the melting process where there
may be flow from under the bed into the melt pool. Two
sets of melting dynamics copied from Tadmor are
presented in Figures 9 and 10.
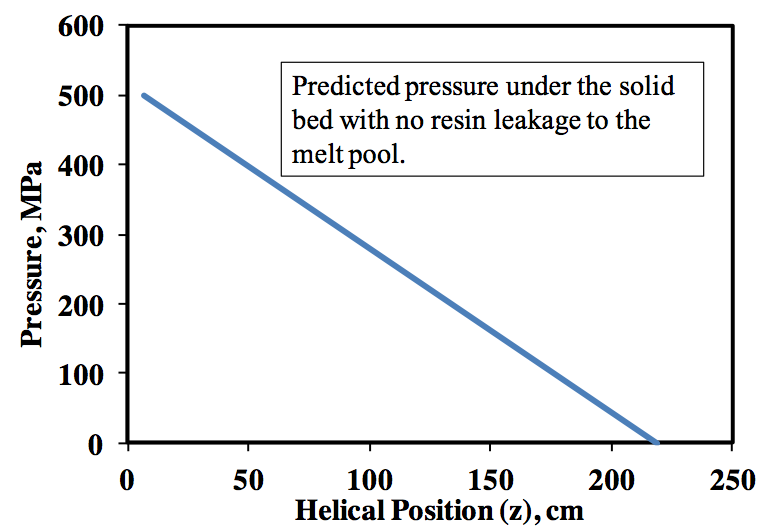
Figure 8. Predicted pressure profile under the solid bed with no resin leakage to the melt pool.
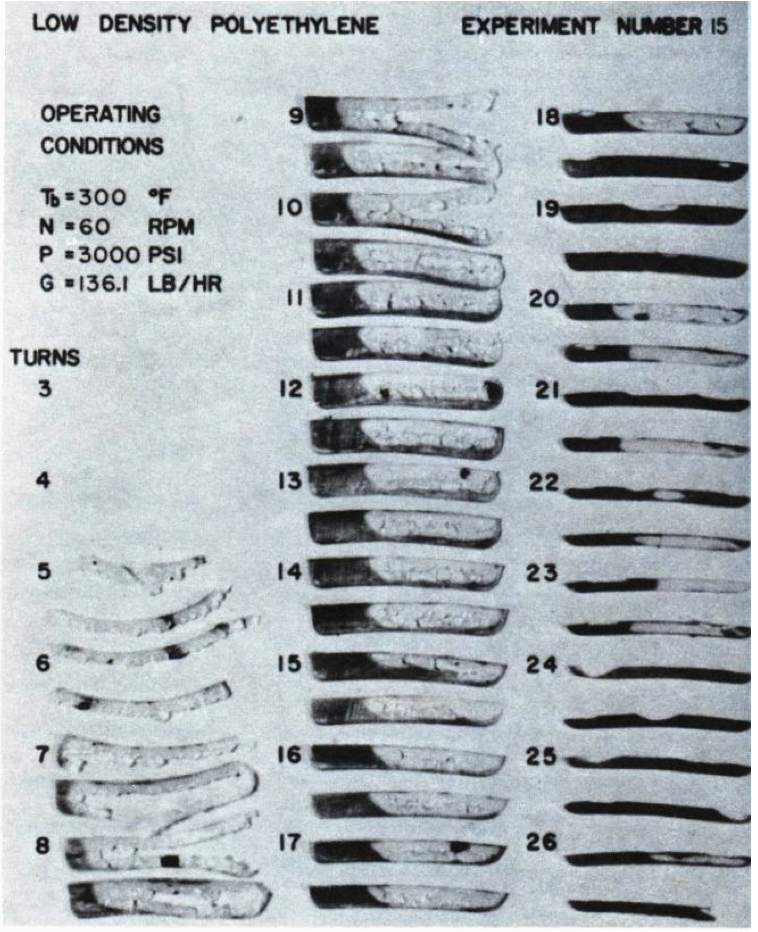
Figure 9. Melting profiles for LDPE resin from Tadmor and Klein Figure 5.16 [4].
One observes in Figure 9 that that the solid bed profile
from section 7 to section 9 in contact with the melt pool is
essentially a vertical surface for a low density polyethylene
(LDPE) resin. However by section 17 the front of the
profile shows that the bottom of the front of the profile has
melted faster than the top, creating a curved interface and
changing the shape of the bed.
The same general observations are made regarding this
melting sequence for a polypropylene (PP) resin as shown
in Figure 10.
The locally high pressure underneath the solid bed and
the positive ∂P/∂x in Film D causes some flow of resin
from Film D to the melt pool. Thus, for a local Δz
increment for Film D, there is material entering the
element from the melting process and from the drag
motion of the screw core, and there is material leaving the
increment from the motion of the screw core and from the
flow of material into the melt pool due to a positive ∂P/∂x.
These complex flows are consistent with observations from
Maddock solidification experiments. This flow is shown in
detail for the Maddock solidification experiment shown in
Figure 11.
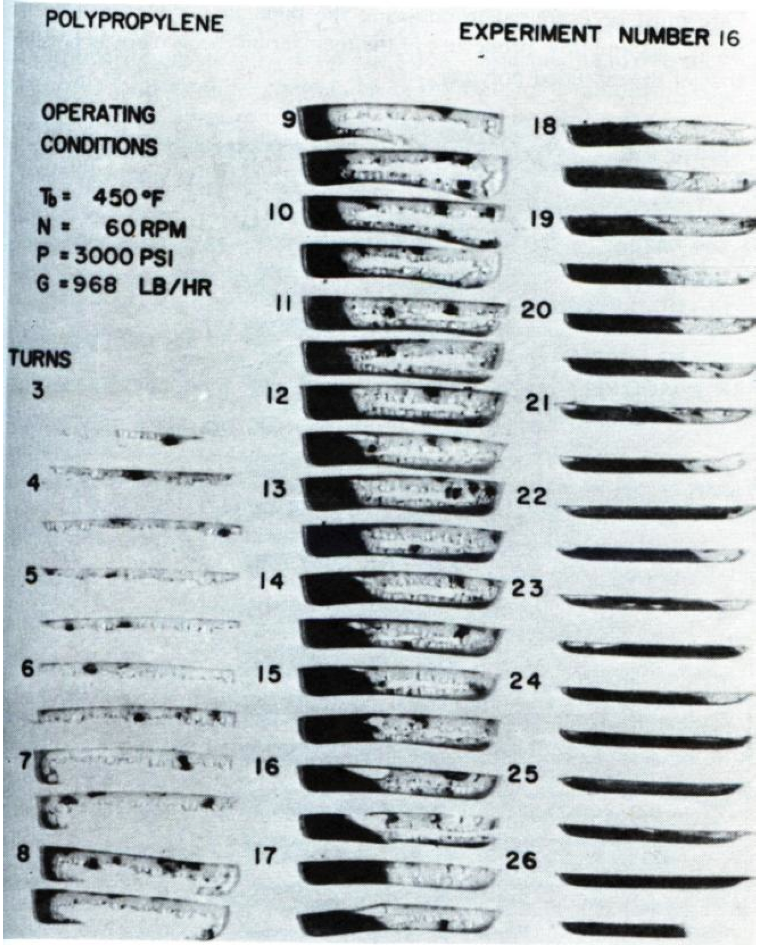
Figure 10. Melting of PP resin from Tadmor and Klein Figure 5.3 [4].
The flow from the film between the solid bed and the
screw root (Film D) can be observed in most Maddock
solidification experiments, as shown in Figure 11. The
section in this photograph was for a location early in the
melting process where the strength of the solid bed is high
and can withstand the pressure gradient created by the flow
induced by the backwards motion of the screw.
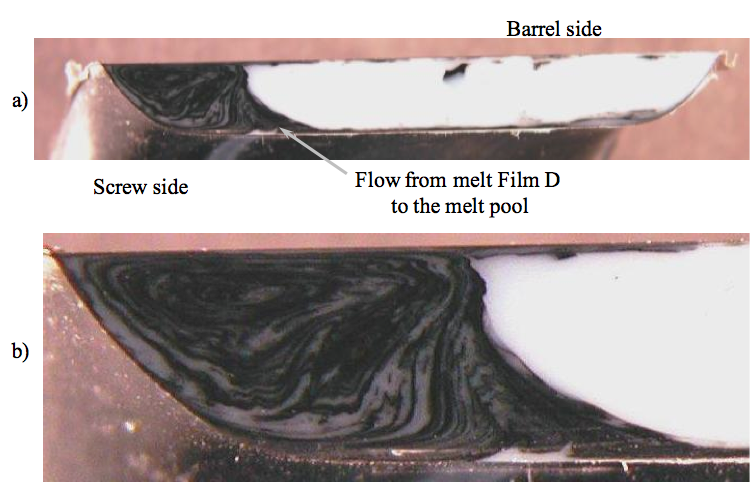
Figure 11 Photograph of resin solidified in the transition section after a Maddock solidification experiment for an ABS resin: a) the arrow is pointing at the flow lines created by the flow of material from Film D out to the melt pool, and b) an enlargement of the flow area.
The high strength of the bed prevents the bed from
breaking up. Flow lines due to poor mixing of the colorant
into the white resin show the flow from Film D into the
melt pool (Figure 11). The flow is substantial as it is
pushing and deforming the recirculating flow of the pool
away from the solid bed. The fluid flowing from under the
bed would be relatively hot due to shear heating as it flows
under the bed. This is postulated as the cause of the more
rapid melting at the base of the solid bed and causing the
shape change of the solid bed at this edge. These flow
patterns can be observed in Figure 2 as well with careful
observation, and the observed flow pattern is not consistent
with a barrel rotation model.
The qualitative expected velocities and pressure
gradient are shown in Figure 7. That is, the backwards
motion of the screw is dragging molten polymer backwards
at the screw root and generating a significant level of
pressure in Film D. When the strength of the solid bed is
relatively high, the high pressure in Film D causes material
to flow out to the melt pool B. If the strength of the solid
bed is relatively low, then the bed will form a small crack
due to the fluid flow induced stresses at the bottom
interface of the solid bed, and then the crack will fill with
fluid as observed by Zhu et al. [6,7]. Since the screw core
develops predominately recirculating flow under the bed,
the fluid would be expected to also flow under the solid
bed toward the metering section (see blue line in Figure 7).
This recirculating flow would cause a shear stress on the
bottom of the solid bed. The upstream velocity in
conjunction with the bed low cohesive energy and cracks
would tend to cause fragments to break off of the bed. The
surface shear stress from the recirculating fluid would thus
drag the solid bed fragments away from the solid bed and
into the metering section. The solid bed breakup process is
qualitatively described in Figure 12.
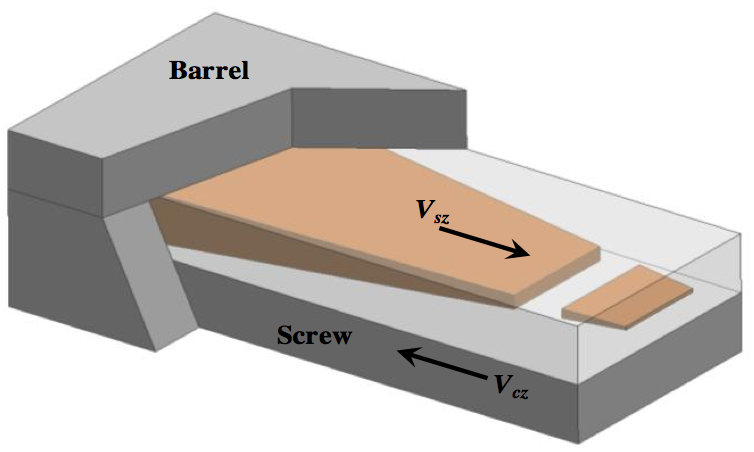
Figure 12. Schematic for solid bed breakup.
Figure 12 qualitatively describes the solid bed breakup
process. For this process, the solid is moving in the V
sz
direction. The motion of the screw drags fluid into Film D between the screw root and solid bed, creating a relatively
high pressure in the film. When the strength of the solid
bed is high, the high pressure induces flow out of the film
into the melt pool. The flow out of Film D into the melt
pool is observed in Figure 11. When the strength of the
solid bed becomes low near the end of the melting process,
the pressure produces a crack as shown in Figure 12, and
then the crack fills with fluid as observed by Zhu et al.
[6,7].
The predicted pressure under the bed with leakage
flow from Film D to the melt pool is presented in Figure
13. The very high pressure as the bed approaches the 0
distance is of course not completely accurate since the
liquid under the bed approaches 0 thickness at this point
and there is likely a static volume where there is little or no
flow
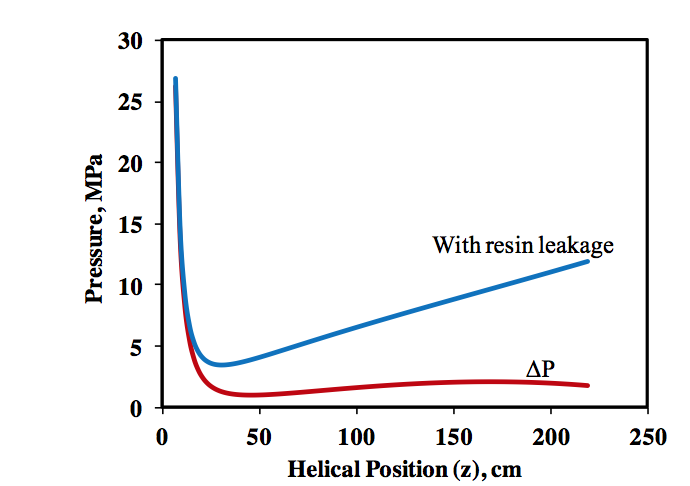
Figure 13. Predicted pressure under the solid bed.
The predicted pressure change between Film D and
the melt pool, ΔP (the red line of Figure 13), decreases
quickly leading to a predicted pressure profile which will
provide leakage flow into the melt pool.
Discussion
The melting model based on screw rotation physics
and the flow due to the negative V
cz velocity provides the
mechanism for solid bed breakup. This paper provides
more detail than originally presented in 2013 [1] on the
mechanism of solid bed breakup. Barrel rotation physics
and models have been unable to explain adequately solid
bed breakup. The mechanism provided here is consistent
with flows observed during Maddock solidification
experiments and the observations by Zhu et al. [6,7].
The flow of resin from Film D to the melt pool causes
some of the solid bed to melt at the interface near Film D.
This melting is very obvious from the photos provided by
Tadmor and Klein [4]. The melting is obvious due to the
extremely small flight radii on the screws used in their
experiments. Thus as melting progresses, the solid bed edge adjacent to the melt pool changes shape as melting
occurs faster at the edge near the root relative to that near
the barrel surface. That is, the edge changed shape from a
vertical surface to a curved surface. Since the flight radii
for the screws used for the experiments in Figure 2 were
considerably larger, this melting at the corner of the bed is
not obvious.
The recirculating flow in the melt pool and the flow
entering the pool from Film D create a region at the screw
root where the flows are likely very low or form eddies.
This low flow region where the recirculating and entering
flow merge is shown in Figure 14. For most extrusion
processes, this low flow region is not a problem and likely
very difficult to detect. For thermally sensitive materials
such as polyvinylidene chloride (PVDC) resin, the long
residence time of the region can cause a ribbon of degraded
material to form on the root of the screw where the flows
merge. This ribbon typically starts when the melt pool first
forms and ends when the melting process is about 70%
complete. A photograph of this type of degradation is
shown in Figure 15. Processing changes can mitigate this
type of degradation [23].
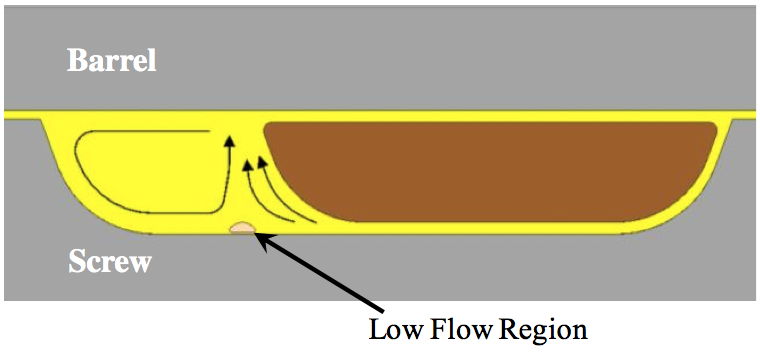
Figure 14. Schematic showing the recirculating flow in the melt pool and the flow entering the melt pool from Film D.
A low flow region exists where the flow streams merge.
The degradation ribbon at the merge of the flows
occurs because of the low flow region created between
cross channel flow of material from Zone D and the
recirculation flow in the melt pool. As shown by Figure 11,
this flow from Zone D is relatively large. As previously
stated, the flow occurs because of pressure induced flow
and the dragging of fresh material under the solid bed by
the backwards motion of the screw root. This process is
consistent with the physics presented for screw rotation.
The flow fields developed for a barrel rotation system
would not create the low flow region such as shown in
Figure 15.
For processes with relatively low compression rates
such that the air entrained between the pellets is not readily
pushed back out the hopper, solid bed breakup will eliminate a pathway for the air back to the hopper. In this
case the entrained air will discharge with the extrudate and
often create defects in the product.
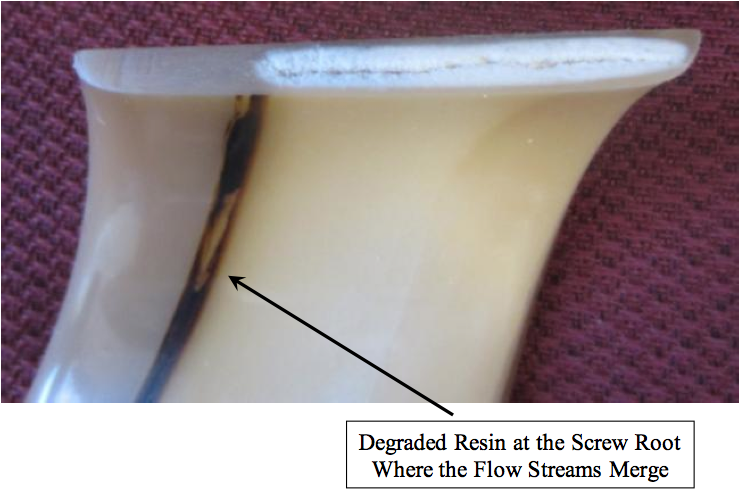
Figure 15. Photograph of a segment from a Maddock solidification experiment for a PVDC resin extrusion. The dark band is degraded resin due to a long residence time at the location.
Solid bed breakup can be mitigated using screw design
and process conditions for a conventional screw design.
For example, the largest single contributor to bed breakup
is high screw speeds. For a particular screw, the extrudates
were relatively free of solid polymer fragments at low
screw speeds. But at screw speeds above about 75 rpm,
solid bed breakup is occurring and high levels of solids are
discharged with the extrudates. Although not desirable for
a commercial process, decreasing the rate of the line is
often a short term fix to eliminating solids in the discharge.
Placing a finer screen in the screen pack is also an
acceptable short term remedy. The best long term fix is to
add an acceptable dispersive mixer to the screw or to
install a high-performance screw.
Several high-performance screws actually take
advantage of solid bed breakup by using the small solid
fragments as a cooling method for the extrudate. For these
designs, the solid polymer fragments are reduced in size
using dispersive type dams. The small fragments are then
melted primarily by heat conduction from the hot molten
resin to the cooler solid fragments, decreasing the
temperature of the molten stream. Common commercially
available high-performance screws that employ this
technology include Wave screws [24,25], Energy Transfer
screws [26,27], Fusion screws [28], and DM
2 screws [29].
Summary
The process of solid bed breakup is described and
demonstrated using photographs from Maddock
solidification experiments. A new theoretical hypothesis is developed based on screw rotation theory that proposes
that the bed breakup is due to the melting process and the
backward flow of material under the solid bed, creating a
high pressure in this gap. If this pressure is high enough to
break the solid bed, solid bed breakup will occur. Flow of
material from under the solid bed to the melt pool has the
ability to change the shape of the edge of the solid bed that
is in contact with the melt pool.
Acknowledgements
The authors are grateful to many colleagues and
students that worked to develop these techniques.
References
1. G.A. Campbell and M.A. Spalding, SPE ANTEC Tech.
Papers, 59, 1087 (2013).
2. G.A. Campbell and M.A. Spalding, “Analyzing and
Troubleshooting Single-Screw Extruders,” Hanser
Publications, Munich, 2013.
3. B.H. Maddock, SPE J., 15, 383 (1959).
4. Z. Tadmor and I. Klein, “Engineering Principles of
Plasticating Extrusion,” Van Nostrand Reinhold
Company, New York, 1970.
5. C.I. Chung, “Extrusion of Polymers, Theory and
Practice,” second edition, Hanser Publications,
Munich, 2011.
6. F. Zhu, A.C.-Y. Wong, R. Liu, and T. Liu, Plastics,
Rubber and Composites Processing and Applications,
26, 8, 343 (1997).
7. Z. Jin, F. Gao, and F. Zhu, Polym. Eng. Sci., 44, 1313
(2004).
8. Z. Tang, MS Thesis, Clarkson University, Potsdam,
NY, Chemical Engineering Department (1999).
9. G.A. Campbell, Z. Tang, C. Wang, and M.
Bullwinkel, SPE ANTEC Tech. Papers, 49, 213
(2003).
10. G.A. Campbell and Z. Tang, SPE ANTEC Tech.
Papers, 50, 162 (2004).
11. J.T. Lindt, Polym. Eng. Sci., 16, 284 (1976).
12. B. Elbirli, J.T. Lindt, S.R. Gottgetreu, and S.M. Baba,
Polym. Eng. Sci., 24, 988 (1984).
13. J.T. Lindt and B. Elbirli, Polym. Eng. Sci., 25, 412
(1985).
14. J.T. Lindt, Polym. Eng. Sci., 25, 585 (1985).
15. J.T. Lindt, Polym. Eng. Sci., 21, 1162 (1981).
16. G.A. Campbell, M.A. Spalding, and Z. Tang, SPE
ANTEC Tech. Papers, 55, 147 (2009).
17. G.A. Campbell and M.A. Spalding, SPE ANTEC Tech.
Papers, 56, 418 (2010).
18. G.A. Campbell, P.A. Sweeney, and J.N. Felton,
Polym. Eng. Sci., 32, 1765 (1992).
19. G.A. Campbell, P.A. Sweeney, and J.N. Felton, Intern.
Polym. Proc., 7, 320 (1992).
20. G.A. Campbell, P.A. Sweeney, N. Dontula, and C.
Wang, Intern. Polym. Proc., 11, 199 (1996).
21. G.A. Campbell, H. Cheng, C. Wang, M. Bullwinkel,
and M.A. te-Riele, SPE-ANTEC Tech. Papers, 47, 152
(2001).
22. G.A. Campbell, C. Wang, H. Cheng, M. Bullwinkel,
M.A. te-Riele, Intern. Polym. Proc., 16, 323 (2001).
23. S.R. Jenkins, J.R. Powers, K.S. Hyun, and J.A.
Naumovitz, J. Plast. Film & Sheet, 6, 90 (1990).
24. G.A. Kruder, US Patent 4,173,417 (1979).
25. G.A. Kruder and W.N. Calland, SPE ANTEC Tech.
Papers, 36, 74 (1990).
26. C.I. Chung and R.A. Barr, U.S. Patent 4,405,239
(1983).
27. C.I. Chung and R.A. Barr, SPE ANTEC Tech. Papers,
29, 168 (1983).
28. T.W. Womer, E.J. Buck, and B.J. Hudak Jr., US
Patent 6,672,753 (2004).
29. M.A. Spalding, J.A. Kuhman, D. Larson, J. Kuhman,
and H.L. Prettyman, SPE ANTEC Tech. Papers, 50,
599 (2004).
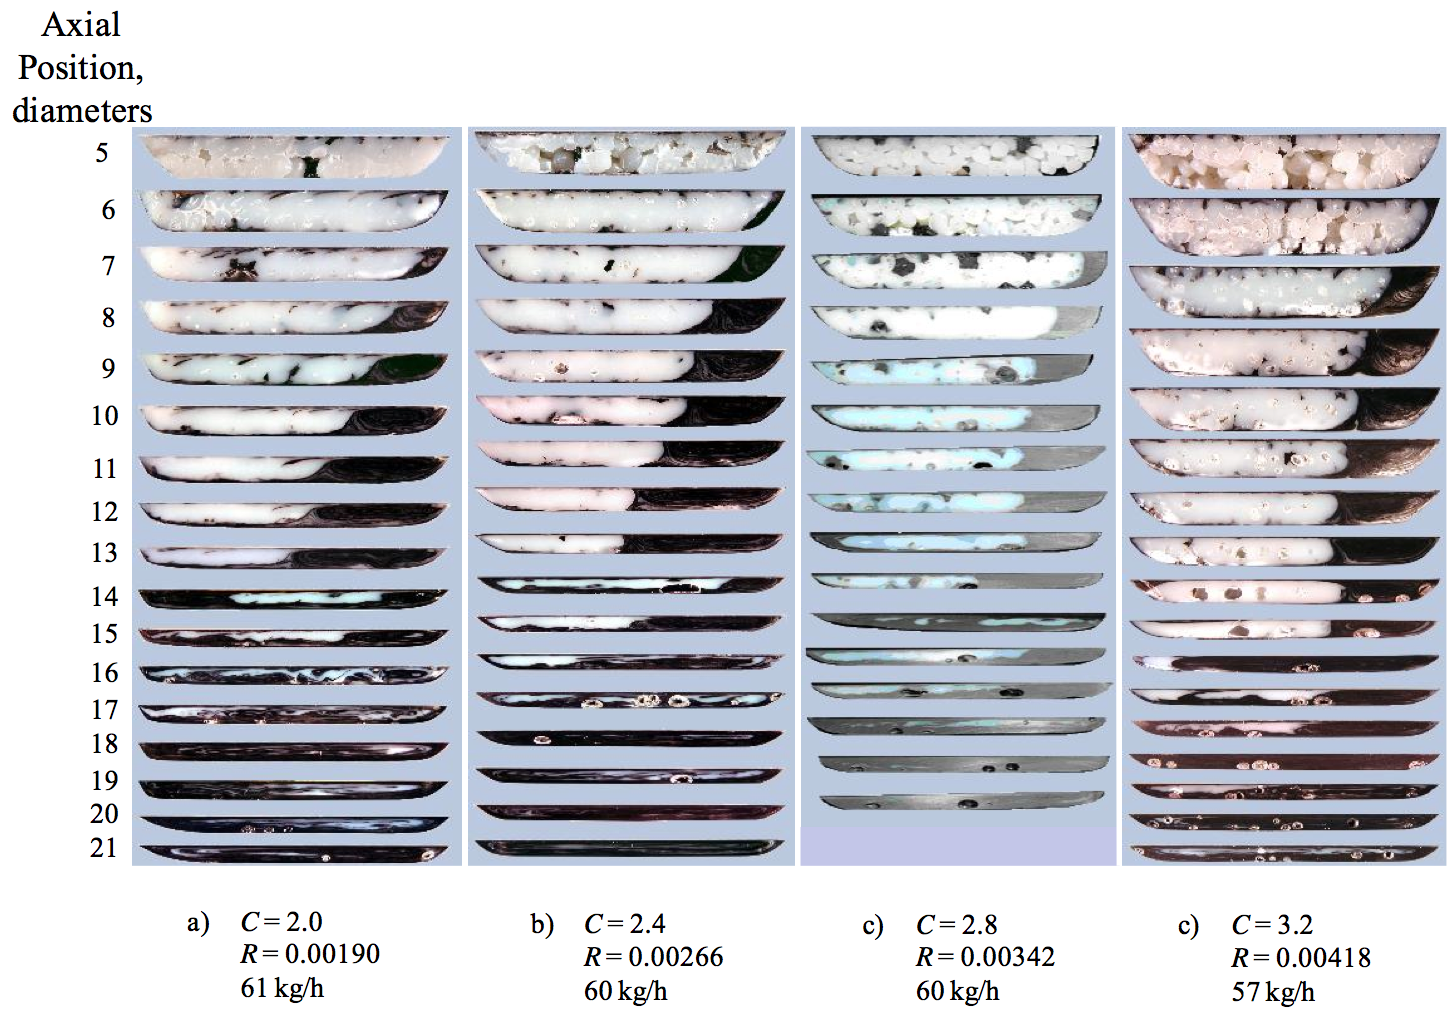
Figure 2. Melting profiles for a 63.5 mm diameter extruder running an ABS resin at 60 rpm for screws with a 3.18 mm deep metering channel, 6 diameters of feed section, 8 diameters of transition, and 7 diameters of metering section: a) compression ratio of 2.0, b) compression ratio of 2.4, c) compression ratio of 2.8, and d) compression ratio of 3.2. The pushing flights are on the right side of the section photographs. The void marks on c) at diameters 16 through 20 were caused by the resin shrinking slightly as it cooled. Compression ratio (C) and compression rate (R) defined in reference [2].
Return to
Paper of the Month.