What's Wrong with Melt Index for Design Input?
Vol. 33 #1, Summer 2006
When it becomes difficult to get viscosity vs. shear rate information there is a tendency for individuals to settle on MI or MFR. Here’s a brief summary of why that is so dangerous.
The apparatus used for determination of the melt index is illustrated in the figure below. Polymer in pellet or powder form is loaded into the reservoir and heated to a specified temperature. A weight is used to extrude the molten polymer through the capillary. The results are reported in terms of the number of grams polymer extruded in ten minutes. Appropriate melt temperatures and extrusion weights are specified in the ASTM standard. As a result of the test one might report, for example, that a polystyrene was found to have a melt index of 4.2 grams/10 min under condition G (200°C and 5kg load).
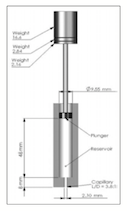
FIGURE 1.
The major shortcoming of the melt index is that due to the short capillary length, L/D=3.8, it is a single point measurement of a mixed shear and elongational flow. The rheological behavior of polymers is strongly dependent on both temperature and shear rate and a single point measurement cannot capture this level of detail. For example, consider the viscosity as a function of shear rate for the two polymers illustrated at right. Rheologically these are very different materials; however, if the effective shear rate for the melt index measurement happens to be at the point where the two curves cross, they will exhibit the same melt index. This is one possible reason why two different lots of the same polymer may have the same melt index, but exhibit different rheological behavior during processing.
The short capillary geometry of the melt index apparatus results in the material experiencing a combination of shear and elongational flow as it is extruded from the reservoir through the capillary. Extensional flow dominates in the transition region between the reservoir and the capillary giving an entrance pressure drop, while shear flow dominates in the capillary itself. Polymers behave differently in these types of flows because of their chain-like structure has a memory and because the melt Index capillary is so short the entrance loss becomes a significant portion of the pressure drop driving the shear flow. Therefore. various combinations of response to shear and elongational flow could also result in rheologically different polymers exhibiting the same melt index.
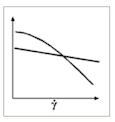
FIGURE 2.
More complete and accurate rheological characterization can be provided by measurements designed to investigate polymer melts at different temperatures and deformation rates in well controlled flow fields. Cone and plate, parallel plate, capillary, and extensional rheometers are designed to do exactly this. The first improvement in quality control over the melt index is usually measurement of the polymer viscosity as a function of shear rate at a representative temperature, and a temperature slightly above and below design. These additional temperatures allow observation of how a polymer will react to temperature adjustments or unexpected temperature variations.
Melt Index values as outlined above are useful only as a general characterization of a polymer fluidity and do not in and of themselves describe the fluid viscosity. Melt index is often used as a QC method for polymerizations and incoming resin shipments. This works for QC because the resin is supposed to be a repeat of the same resin. It is not, however, a reasonably effective process simulator for typical polymer processing operations in extruders, coextrusion, and dies.
Most processing operations involve a combination of shear and elongational flows, but at vastly different rates. An extrusion die, for example contains various geometries or transitions, and polymer can traverse shear rate regions from <1 sec-1 to >1000 sec-1. Different angles and transitions provide regions of different elongational flow.
A final note of caution. Even the most trusted source of viscosity data is providing information created on a laboratory device at a uniform melt temperature. That laboratory device will provide technical data based solely on the conditions it used to produce the information. This device may closely replicate the conditions on a perfectly designed extruder, with perfect screw to barrel clearance, and perfect temperature control, and an ideal screw design with uniform melting and mixing. It is them assumed that perfectly uni- form melt of a uniform temperature is delivered to a Feedblock or Die connected to transfer pipes running adiabatically (no viscous dissipation or temperature gradient from extended residence time). It is known from experience that many melt pipes are far from meeting these criteria. It seems a daunting task to get representative viscosity data for product design.
The old adage “Garbage in = Garbage out” applies to the performance of melt processing equipment. The better the quality of viscosity information, the better the performance of the equipment processing said melt. Shear rate vs. viscosity information from an unreliable source is no better than trying to design from melt index.
Interpretation of rheological data is often deceiving and should ultimately be interpreted by an expert. It is imperative the information is acquired from a reliable source, and if testing is required, it must be accomplished by a responsible lab.
– Gary Oliver, Cloeren Incorporated
Return to
Consultants' Corner