The Influence of Design and Processing Parameters on the Mixing Performance of a Fluted Mixer
Pavel Kubik, Tomas Bata University in Zlín, Department of Polymer Engineering, Zlín, Czech
Republic
Martin Zatloukal, Tomas Bata University in Zlín, Centre of Polymer Systems, Polymer Centre, Zlín,
Czech Republic
Yutaro Asai, I.T.S. Japan Corporation, Misaki, Funabashi-shi, Chiba, Japan
Ryuichi Haruna and Yoshihiko Iwasaki, Pla Giken Co. LTD,Toyotsu-cho, Suita-city, Osaka, Japan
Jiri Vlcek, Compuplast International Inc., Zlín, Czech Republic
Ilja Paseka, Compuplast Software spol. s r. o., Zlín, Czech RepublicAbstract
In this paper, the mixing efficiency of two slightly
different fluted mixing elements is studied. RGB spectral
analysis is used for the quantification of the mixing. The
overall mixing appears to be equal after sufficient mixing
time. The mixer without the wiping flight, however,
creates a stagnation layer of material which rotates
between the mixer and the barrel. This layer is
characterized by a long residence time. The residence time
of the layer is twice as long as for a mixer with the wiping
flight. The long residence time is again measured by RGB
spectral analysis and also visualized in the video. The
results of a 3D FEM simulation shows that the mass flow
rate of the stagnation layer represents almost 50% of the
total mass flow rate.
Introduction
Mixing is a very important process in single-screw
extrusion. Achieving good mixing performance, under
specified processing conditions, is a key requirement to
obtain a uniform and homogenous mixture. So, it is not
surprising that considerable effort is spent on analyzing
different types of “mixing elements”, “mixing heads” or
“mixing sections” in single-screw [1-6] and also twinscrew
[7-13] extrusion. In principle, there are two basic
mixing mechanisms. Dispersive mixing is based mainly
on reducing the size of mixture components by shear or
elongational stress. The second one is distributive mixing
that redistributes particles throughout the volume [14].
A fluted mixing element, also known as the Maddock
mixer [15], is one of the most often examined dispersive
mixing sections in extrusion. Almost forty years ago,
Tadmor and Klein [16], studied certain designs of fluted
mixing sections and proposed a model for calculation of
pressure development through the fluted mixing section.
Tadmor et al. [17] later improved the model by using the
Flow Analysis Network method. Esseghir et al. [18]
carried out a detailed comparative study of three different
single-screw mixing elements including the Maddock
mixer section.
Han and Lee [19] experimentally and also
numerically investigated the flow in the Maddock mixer.
Their work focused mainly on pressure drop and pressure
rise through the mixer. Their results clearly concluded that
pressure was generated, under specific processing
conditions, and therefore drag flow was predominated
over pressure-driven flow. In their work, only 2D analysis
was used to compute simulation results and the mixing
performance of the Maddock mixer section was not
evaluated.
In this work, the evaluation of the mixing
performance using the Red-Green-Blue (RGB) spectral
analysis is presented. The study is focused on color
dispersion of the material extruded by two general
purpose screws having slightly different fluted mixing
sections. The “Closed” design has alternating “shearing”
and “wiping” dams (or flights) while the “Open” design is
completely undercut so that there are no “wiping” dams. It
can be seen that the “Open” design is easier to
manufacture and many people assume that this geometry
change has little, or negligible, impact on its overall
mixing performance. To investigate this assumption,
experiments, comparing these two fluted mixer designs,
have been performed. A three dimensional Finite Element
Method (3D FEM) simulation is also used to help analyze
and better understand the fluted mixing element flow
field.
Methods
Two general purpose screw designs were prepared for
this experiment. The basic screw dimensions are
summarized in Table 1.
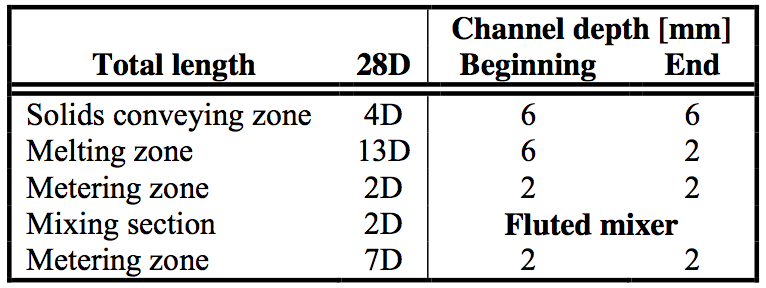
Table 1. Basic screw dimensions
The only variation between these two screw designs
is the mixing section where two slightly different fluted
mixing elements were used, as shown in Figure 2. Both
mixers had three pairs of channels. The shearing gap
width was 9.5 mm, its depth was 0.4 mm and a radius of
each channel was 7.2 mm. The length of the shearing gap
was 80 mm.
The “Closed” mixer has separated pairs of inlet and
outlet channels with a shearing gap in between. The
wiping flight prevents material flow and cleans the barrel
surface.
The “Open” mixer has undercuts from both sides of
each channel. Thus, the material is not wiped from the
barrel surface. The melt can also enter the channel from
the side and not only from the inlet. Therefore, part of the
melt can continuously flow in the gap between the mixer
and the barrel.
Experiments were done on a special extrusion line
with a barrel having several glass windows which are
alternately placed on both sides of the barrel as shown in
Figure 1. This allowed observation of the polymer melt
along the extrusion line from the solids conveying zone to
the metering zone. Dimensions of each window were
90x10 mm and the internal diameter of the barrel was 40
mm.

Figure 1. Barrel sketch
The mixer was positioned to be visible through the
glass window (black window in Figure 1). The open and
closed mixer configurations are shown in Figure 2.
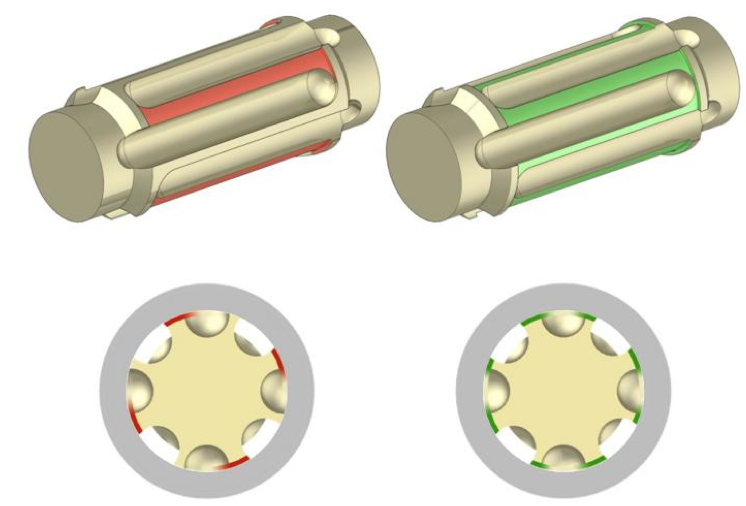
Figure 2. “Closed” (right side) and “Open” (left side) mixer configurations
The output of the extrusion line was connected with a
small flat die followed by a system of chill rolls to obtain
a uniform film. All experiments were continuously
recorded by a video camera which was set on a tripod.
Experimental processing conditions are given in Table 2.
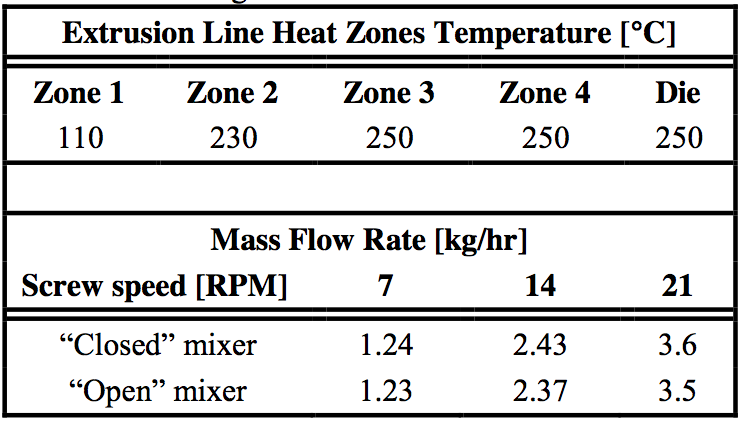
Table 2. Processing conditions
Material
The main material used for the study was Hi-Zex
6300M HDPE. Rheological properties were measured on
a laboratory grade twin-bore capillary rheometer (Imatek
R6000 [20]) with Φ 1x16mm long die and Φ 1×0.25mm
short die. Viscosity curves are shown in Figure 3.
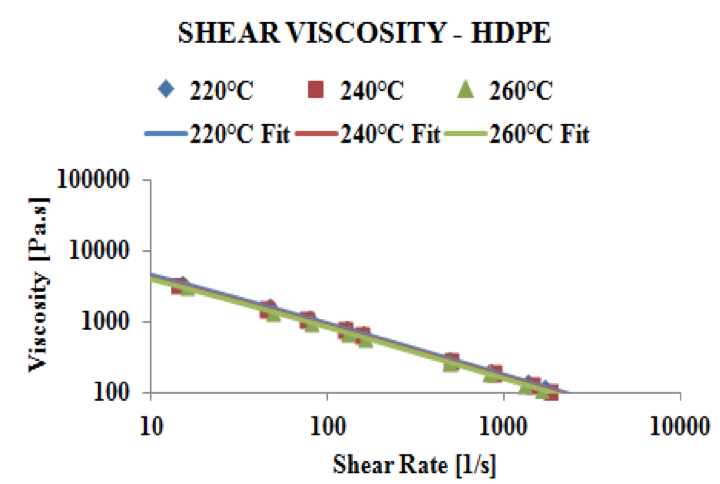
Figure 3. Viscosity curves of HDPE
The rheological data were fitted by the well known
Carreau-Yasuda model, in which the viscosity dependence
is decribed by the following equation:

Where η
0 is the zero shear viscosity, a, n, λ are
constants, T is temperature and II
D stands for the second
invariant of the deformation rate tensor. The material
temperature dependence f(T) is exponential and is given
by an equation:

The parameter b represents the temperature sensitivity
and T
r is the reference temperature. The Model variables
are presented in Table 3.
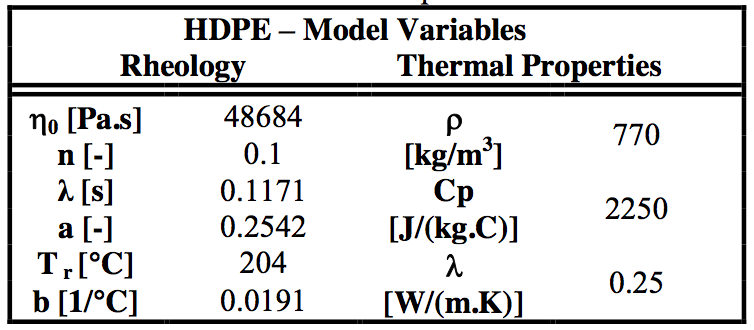
Table 3. Carreau-Yasuda Model parameters
A LLDPE based, green masterbatch was used for
visualization and mixing performance analysis.
Experimental
The experiment was focused primarily on the mixing
performance of the fluted mixing elements. To avoid
blending errors, clear HDPE was pushed through the extrusion line until the hopper was almost empty. Next, a
certain amount of the colorant (about 60g) was added to
the hopper to a 2 cm layer. This layer of colorant was
followed by a new layer of clear HDPE of the same
volume. By this method, five distinct layers in order
colorant – HDPE – colorant – HDPE – colorant were
prepared. Each new layer was always added after the
previous layer had completely left the hopper. A screw
speed at 21 RPM was used to run this experimental
procedure.
The moment when the first colored particles appeared
at the end of the extrusion line was the starting point of
the measurement. Then, samples of the flat film were cut
to see interactions between the clear and colored regions
of the polymer. Thus, this experimental part provides
some indication about the speed of the mixing process.
All experimental parameters were identical for both
mixing sections. These samples were later analyzed in a
professional Canon scanner. The scanner light was strong
enough to reveal the mixing patterns of the samples. Hiresolution
tiff format pictures were prepared for further
analysis. All samples were 3x8 cm. Color pictures of
scanned samples were studied in special program routine
where the statistics of simple pixels were evaluated. Some
examples of the scanned flat film samples for the “Open”
and “Closed” mixer are presented in Figure 4 and 5,
respectively.
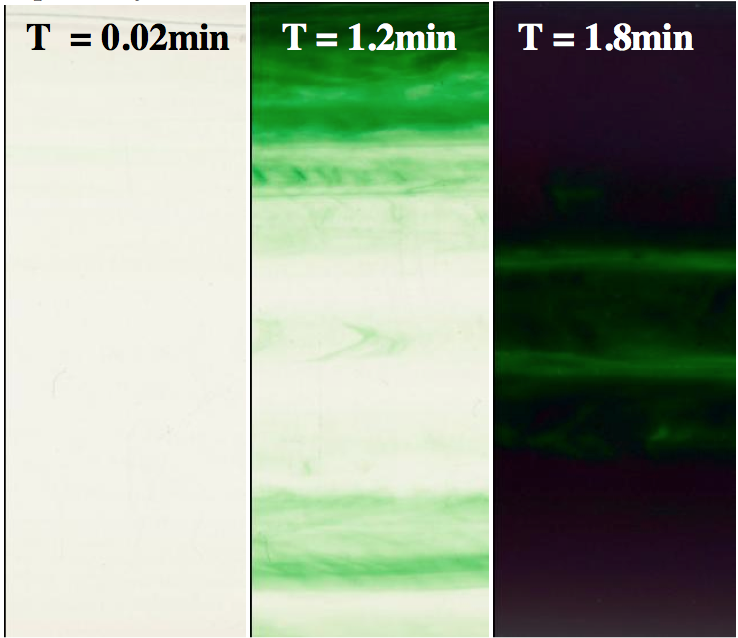
Figure 4. Film samples in different extrusion times by using the “Open” mixer
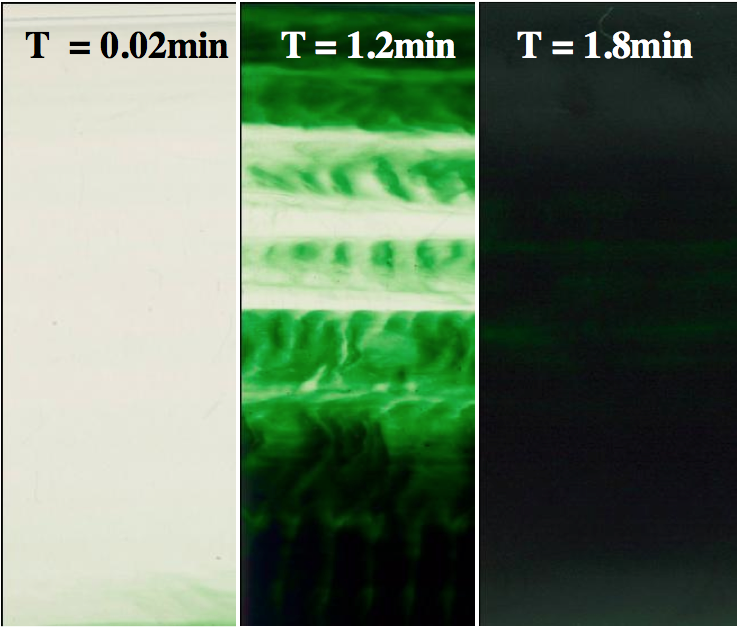
Figure 5. Film samples in different extrusion times by using the “Closed” mixer
Then, an average value of RGB spectra and its
deviation was obtained for each pixel. The average value
of RGB spectra μ is described by the following equation:

Where M, N represents the number of pixels of the
sample and d
ij stands for the RGB value of the relevant
pixel. d
ij was taken in each pixel as an average of three
RGB values:

RGB color components of a pixel range values from 0
({0,0,0} black) to 255 ({255,255,255} white). Thus, the
material without any additives, pure polymer melt, has a
high mean value of RGB. On the other hand, the dark
material with added colorant had to have a low mean
value of RGB. The degree of brightness, in between the
low and high mean value, represents the degree of mixing.
The value of the unmixed regions is the deviation of
average RGB color. The deviation of the average RGB
spectra was calculated by the equation:

Where M, N represents the number of pixels of the
sample and d
ij stands for the RGB value of the relevant
pixel and μ is the mean value of RGB color. The average RGB value reduces as the colorant is added into the
process until the mean value of RGB reaches a steady
state. The transition from the pure polymer to its colored
form is detected by an increase of the deviation of RGB.
The results of RGB spectral analysis equations of the
mixing performance can be seen in Figure 6.
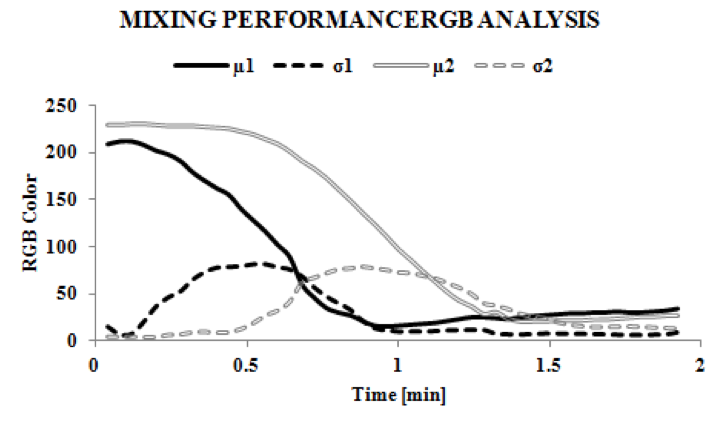
Figure 6. RGB analysis of the mixing performance 1 = Closed mixer, 2 = Open mixer
As shown in the figure, both curves of the average
RBG spectra started above 200, which meant that they
both were close to the white color with a minimum
amount of the green colorant. The decreasing trend of
both curves had a similar slope, but the “Closed” mixer
(μ1) reduced sooner than the “Open” mixer (μ2). The
difference between the “Open” and “Closed” mixer was
about 0.4 minutes. Furthermore, the final, steady state
RGB value for each mixer is very close. This means that
both mixers can provide similar mixing levels, given
sufficient time.
The absence of the wiping flight allowed the formation
of a layer of the slowly moving material which was
rotating close to the barrel surface. The second
experimental method was then focused on the behavior of
this layer. Probably the most significant variable to
characterize the behavior of this layer was the residence
time. Thus, one layer of colorant followed by the pure
polymer was again added into the almost empty hopper.
A low screw speed of 7RPM was intentionally used to
clearly see the layer behavior. Samples of the flat film
were again cut, in ten minute intervals, to calculate the
mean value of RGB of the polymer. The transition from
pure polymer to maximum color and back to the pure
polymer also gave a residence time of the flow field.
Samples were again evaluated with the RGB spectral
analysis.
The RGB curves of the residence time of the “Closed”
(μ1) and “Open” mixer (μ2) are displayed in Figure 7.
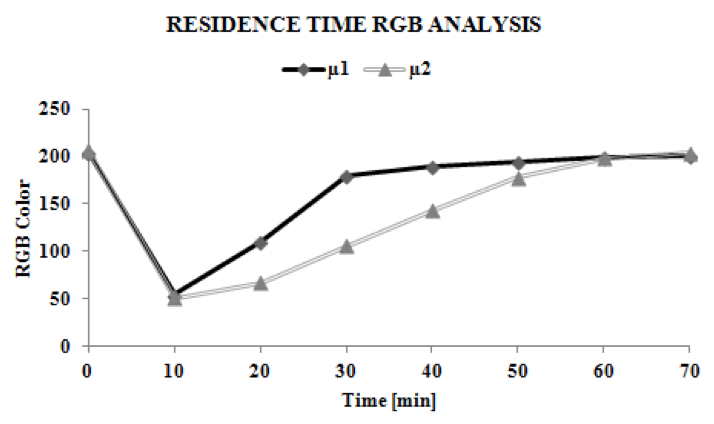
Figure 7. Residence time RGB analysis
1 = Closed mixer, 2 = Open mixer
As can be seen, in Figure 7, the RGB curve started
from pure HDPE at time zero and after ten minutes, the
minimum RGB value green color was obtained. The first
ten minutes was sufficient time for both mixers to achieve
the same level of mixing. Then, the amount of green
colorant gradually reduced with each new sample taken
from the system. These results show that the “Closed”
mixer resulted in faster purging than the “Open” mixer
and returned close to its initial RGB value after forty
minutes versus seventy minutes with the “Open” mixer.
The longer purging time, of the “Open” mixer, was due to
the presence of the slowly rotating layer rotating in the
gap region. This layer was difficult to purge out because
of the absence of the wiping flight. The layer was still
clearly visible after ninety minutes but its effect on the
product color was negligible by this time. The experiment
was recorded to help visualize the rotation of the material
in this layer. The long residence time of the layer could
certainly influence the final quality of the due to polymer
melt degradation. Furthermore, this layer would also
affect the heat transfer from the melt to the barrel surface.
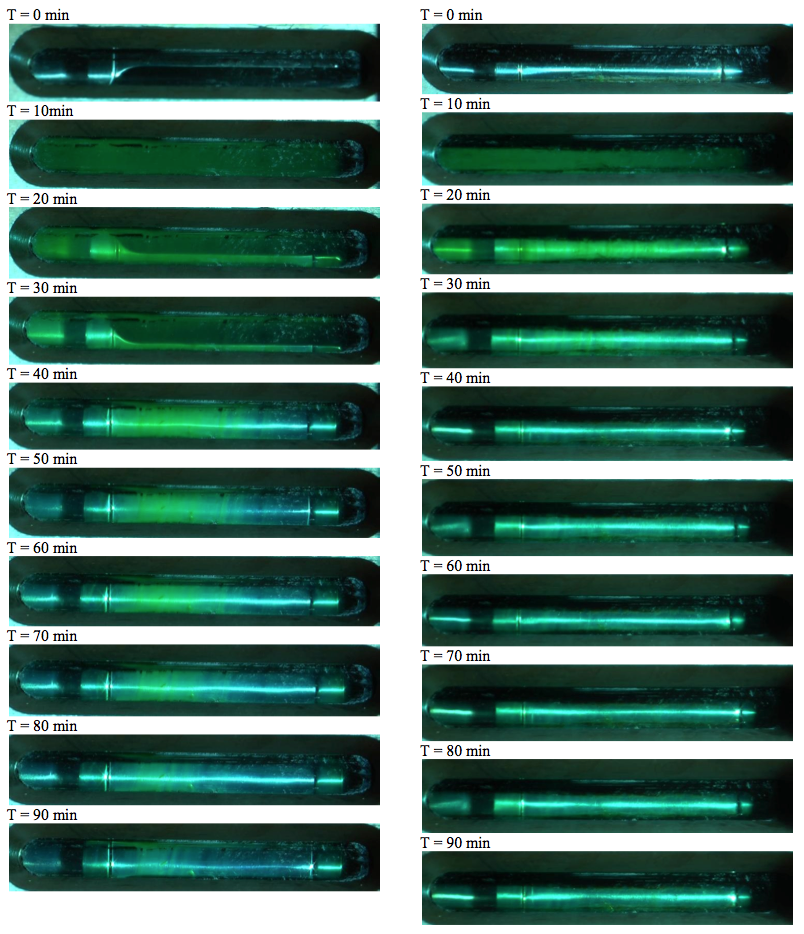
Screen captures from the video, comparing the color
change in between the “Open” and “Closed” mixers are
shown in Appendix 1.
Simulation Results
The slow, moving layer in the “Open” fluted mixer
configuration was further investigated by 3D FEM
simulation. A 3D FEM grid, of the mixer geometry, was
generated with the fluted mixer template in the Virtual
Extrusion Laboratory (VEL
TM) software [21]. To help
ensure high accuracy, quadratic, 27 node, brick elements
were used. The grid was constructed from 16,512
elements for the “Closed” mixer flow domain and 17,792
elements for the “Open” mixer. The periodic nature of the
geometry allowed for the analysis of only 1 pair of
channels. The 3D FEM grid is displayed in Figure 8.
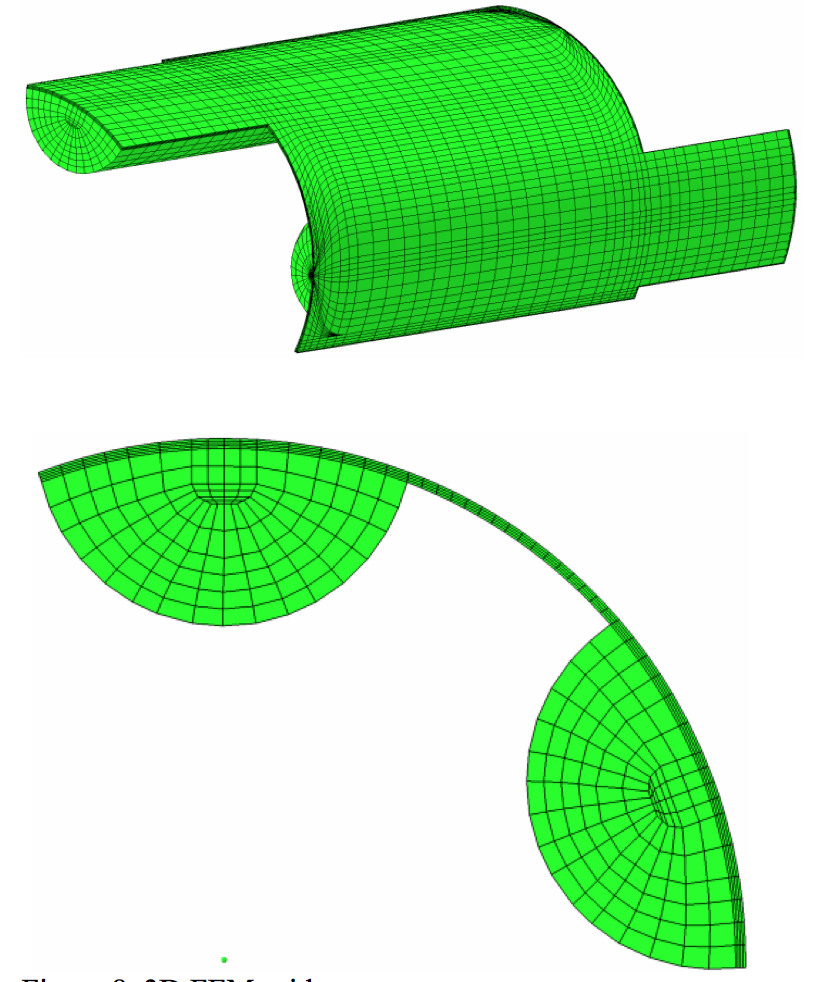
Figure 8. 3D FEM grid
The flow behavior was analyzed with over 60
particle pathlines. Some typical pathlines, which are
representative of the flow behavior in the “Open” and
“Closed” mixer, are depicted in Figures 9 and 10.
The “seed” location of the pathline was placed in
center of the shearing gap, in the middle of the mixer. The
same “seed” point was used for both the “Open” and
“Closed” mixer. However, the “Open” mixer had a second
pathline from a “seed” at the center of the second
undercut, as well.
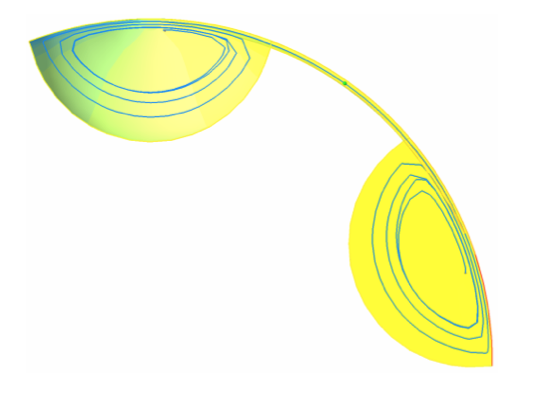
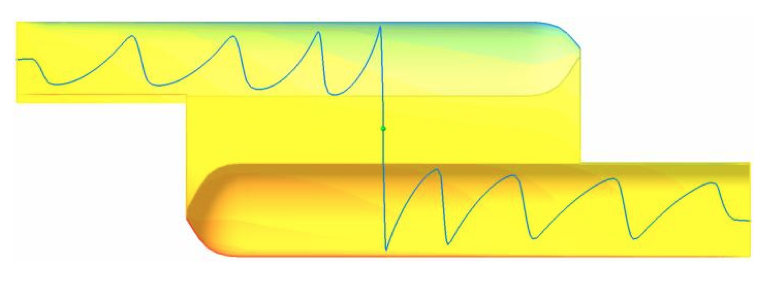
Figure 9. Typical Pathline in the “Closed” mixer
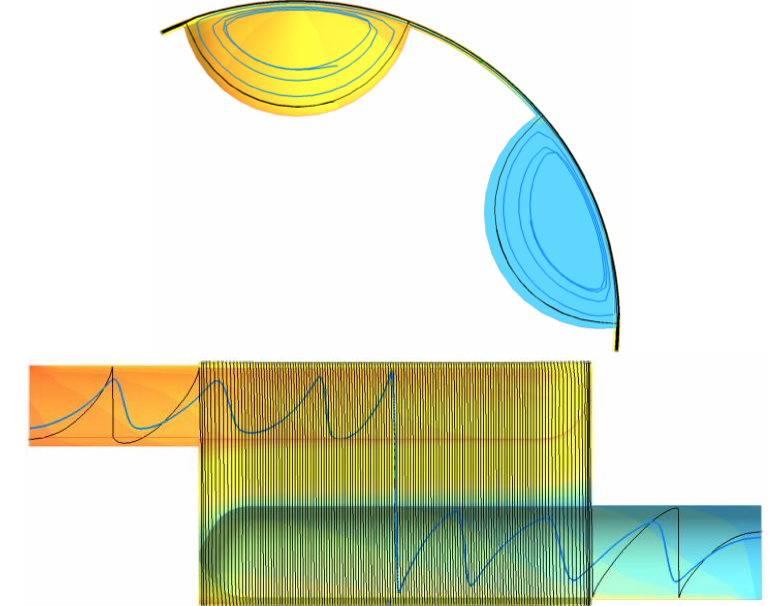
Figure 10. Typical pathlines in the “Open” mixer
It can be seen, from figure 9, that the “Closed” mixer
resulted in the pathline making only one pass through the
shearing gap while Figure 10 show a pathline making
many rotations in the gap region. This represents a high
residence time layer near the barrel surface. This layer is
created because of the absence of the wiping flight.
Surprisingly, the layer fully filled the whole second
undercut channel. Then, the layer was squeezed above the
deep channel of the mixer and remained near the barrel
through the shearing gap and the other deep channel
before it reached the opposite undercut.
The squeezing of the layer is due to the rotation of
the material flowing from the inlet channel. Interestingly,
the mass flow rate of this layer was found to be constant
throughout the gap region essentially forming two almost
separate, independent flows inside of the “Open” mixer.
The mass flow rate over the second undercut was found to
be about 50% of the overall mass flow rate coming from
the inlet channel. The results are given in Table 5.

Table 5. Mass flow rate of the layer
The residence time of this layer, estimated by the 3D
FEM simulation, was also much longer than the overall
residence time of all other pathlines. The average
residence time calculated from more than sixty pathlines
in the “Closed” and “Open” mixers was similar. The
residence time of some typical pathline in the layer was
found to be at least ten times longer than the average
residence time of the mixers. Average and layer residence
times, at three screw speeds are shown in Table 6.

Table 6. Calculated residence times
Tables 5 and 6 indicate that about 50% of the material
flowing in the “Open” mixer has a much larger residence
time. This effectively results in the “Open” mixer having
a longer average residence time but also a much broader
residence time distribution; both of which, may result in
degradation problems for some polymers.
Conclusions
RGB spectral analysis was used to quantify the speed
of the mixing process for the “Open” and “Closed” fluted
mixers. The “Closed” mixer showed a transition from the
pure polymer melt to fully mixed that was 0.4 minute
faster than the “Open” mixer. However, the overall, final
mixing performance of both fluted mixer designs appears
to be seemingly equal.
The “Open” mixer configuration of the fluted mixing
element also creates a layer of the material which rotates
above the shearing gap and second undercut. This layer is
formed because of the absence of the wiping flight. An
almost independent, slow moving flow field appears to
form in this region. The mass flow rate of this layer is
equal to the mass flow rate over the second undercut
which is about 50% of the mass flow rate entering the
mixer. The layer is characterized by the long residence
time and increases the residence time distribution of the
mixer. RGB spectral analysis was used to calculate the
time needed for the purging of the colorant out of the
extruder. Purging time of the extruder equipped with the
“Open” mixer is twice as long as that for the “Closed”
fluted mixer. Recorded video of the experiment, on a glass
window extruder showed the development of the slow
moving layer in the “Open” mixer. The longer residence
time of the layer with the “Open” mixer is also calculated
by 3D FEM simulation. The long residence time of this
layer can explain some extrusion problems such as
polymer melt degradation. Thus, even if the “Open” fluted mixer is easier to manufacture, it is not recommended for
processing thermally sensitive polymers.
Acknowledgement
The authors would like to thank the Plagiken co., Ltd
for financing the experiments and Compuplast
International, Inc. for supplying of the VELTM software.
The authors also wish to acknowledge Operational
Program Research and Development for Innovations cofunded
by the European Regional Development Fund
(ERDF) and national budget of Czech Republic, within
the framework of project Centre of Polymer Systems (reg.
number: CZ.1.05/2.1.00/03.0111) for the financial
support.
References
1. A. L. Kelly, E. C. Brown and P. D. Coates, Polymer
Engineering and Science 46, 1706-1714 (2006).
2. D. Strutt, C. Tzoganakis and T. A. Duever, Polymer
Engineering and Science 40, 992-1003 (2000).
3. B. Elbirli, J. T. Lindt, S. R. Gottgetreu, and S. M. Baba,
SPE-ANTEC Tech. Papers 29, 104 (1983).
4. A. Kiani, R. Rakos, and D. H. Sebastian, SPE-ANTEC
Tech. Papers 35, 62 (1989).
5. G. M. Gale, SPE-ANTEC Tech. Papers 29, 109 (1983).
6. D. Herridge and D. Krueger, SPE-ANTEC Tech. Papers
48, 633 (1991).
7. G. Shearer and C. Tzoganakis, Advances in Polymer
Technology 20, 169–190 (2001).
8. D. Strutt, C. Tzoganakis and T. A. Duever, Advances in
Polymer Technology 19, 22–33 (2000).
9. M. A. Huneault, M. F. Champagne and A. Luciani,
Polymer Engineering and Science 36, 1694-1706 (1996).
10. V. L. Bravo and A. N. Hrymak, Polymer Engineering
and Science, 40, 525-541 (2000).
11. V. L. Bravo, A. N. Hrymak and J. D. Wright, Polymer
Engineering and Science 44, 779-793 (2004).
12. R. Valette, T. Coupez, C. David and B. Vergnes,
International Polymer Processing 24, 141-147 (2009).
13. T. Ishikawa, et al., International Polymer Processing
21, 354-360 (2006).
14. C. Rauwendall, Polymer Extrusion, Munich: Carl
Hanser Verlag, 1990.
15. B. H. Maddock, SPE Journal, 23, 23 (1967)
16. Z. Tadmor and I. Klein, Polymer Engineering and
Science 13, 382-389 (1973).
17. Z . Tadmor, E. Broyer, and C. Guttfinger, Polymer
Engineering and Science 14, 660-665 (1974).
18. M. E. Ghir, C. G. Gogos, D. W. YU, D. B. Todd and
B. David, Advances in Polymer Technology 17, 1-17
(1998).
19. C. D. Han, K. Y. Lee, and N.Wheeler, Polymer
Engineering and Science 31, 818-830 (1991).
20. http://www.imatek.co.uk/product-r6000.php
21. http://www.compuplastvel.com
APPENDIX 1
RESIDENCE TIME VIDEO SAMPLES |
RESIDENCE TIME VIDEO SAMPLES
“Open” mixer(left) | “Closed” mixer(right)
Return to
Paper of the Month.