The Effect of Coathanger Die Manifold Symmetry on Layer Uniformity in Multilayer Coextrusion
Joseph Dooley, Hyunwoo Kim, Patrick C. Lee, and Robert Wrisley
The Dow Chemical Company, Midland, MIAbstract
Multilayer coextrusion is a process in which two or
more polymers are extruded and joined together in a
feedblock or die to form a single structure with multiple
layers. This paper will discuss the effect of die manifold
channel symmetry of the flow of coextruded structures
through coathanger style dies.
Introduction
Many polymers are extruded through various styles of
dies to produce monolayer and multilayer products.
Coextrusion is a common method used for producing
multilayer structures. Coextrusion is a process in which
two or more polymers are extruded and joined together in a
feedblock or die to form a single structure with multiple
layers. This technique allows the processor to combine the
desirable properties of multiple polymers into one structure
with enhanced performance characteristics. The
coextrusion process has been widely used to produce
multilayer sheet, blown film, cast film, tubing, wire
coating, and profiles [1-6].
This paper will discuss the effect of die manifold
channel symmetry on the flow of coextruded structures
through coathanger style dies. Experimental and numerical
data will be shown on the flow of coextruded polymer
melts through several different die manifold channels
containing different levels of symmetry. These data will
then be used to show how the flow and layer distribution of
coextruded structures is affected by the symmetry or
asymmetry of the die channel.
Background
Many different types of monolayer and coextruded
polymeric structures are currently produced using different
styles of dies. However, analyzing the flow of polymer
melts through dies can be difficult due to the complex three
dimensional flow patterns that exist [7-10]. This analysis
becomes even more complex when multiple layers of
different materials are introduced into the structure through
coextrusion methods [11-21].
Shaping operations for polymers cover a wide range of
technologies producing products such as flat sheet, cast
film, blown film, pipe, bottles, fibers, profiles, and many
others. Since each of these products requires a different
die to shape the polymer into its final form, the number of die types that have been developed is enormous. Because
of the large number and different styles of die designs,
many die distribution manifold styles have been developed.
These designs have varying levels of channel symmetry
depending on the final product shape and the difficulty in
the fabrication of the die. The purpose of this work was to
experimentally and numerically determine the flow and
layer distribution of coextruded structures flowing through
coathanger style dies containing distribution manifold
channels with different levels of geometric symmetry.
Experimental
A commercially available resin, STYRON 484 High
Impact Polystyrene (HIPS) resin manufactured by
Americas Styrenics was used in the experiments. This
resin has a Melt Flow Index of 2.8 (dg/min, 5 kg weight,
200 ºC) and a specific gravity of 1.04. The rheology of this
resin at our processing temperature of 215 ºC is shown in
Figure 1.
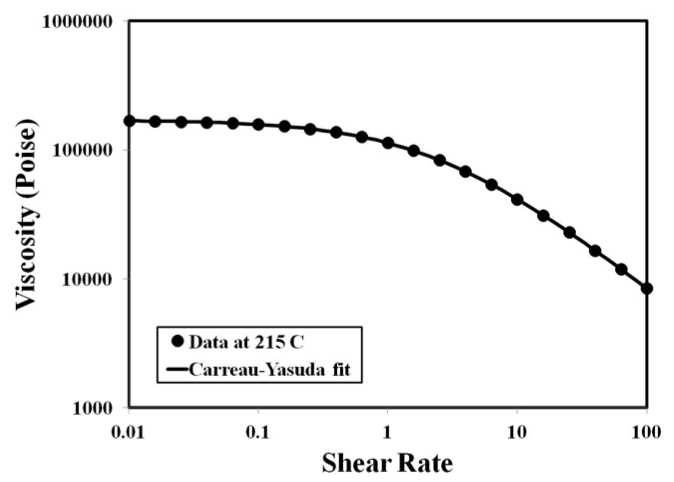
Figure 1. Rheology of HIPS Resin at 215 oC.
The coextrusion line used in this study consisted of
two 31.75 mm (1.25 inch) diameter, 24:1 L/D single screw
extruders and a 25.4 mm (1.0 inch) diameter, 24:1 L/D
single screw extruder. The extruders fed individual gear
pumps to ensure uniform flow of the polymer melts to the
feedblock and dies. The gear pumps were attached to a
feedblock by transfer lines that contained variable depth
thermocouples to ensure consistent and uniform
temperatures from the extruders. A feedblock was used to
produce layered coextruded structures with either 3 or 200
layers. These layer arrangements allowed us to look at both simple (3 layer) and more complex (200 layers)
systems as they flowed through the die. The layered
structures consisted of 10% skin layers and an 80% core by
volume. Coextruded structures were made using the same
material in each extruder with different colored pigments
added to each to allow determination of the interface
location in the structure.
A schematic diagram of the extrusion line set-up is
shown in Figure 2. This simplified diagram shows only
two of the three extruders that can be used in this system.
This system can be configured in different combinations to
produce the 3 layer and 200 layer coextruded structures
described earlier.
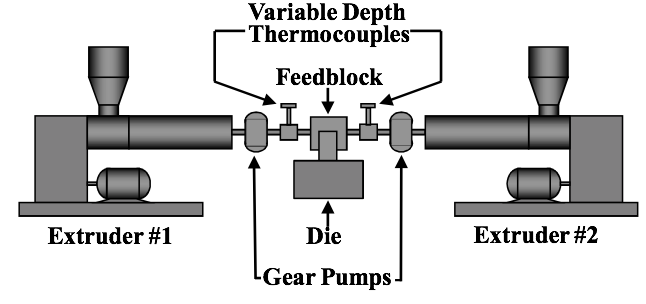
Figure 2. A schematic diagram of the extrusion line.
The flow through a coathanger style die is shown
schematically in Figure 3.
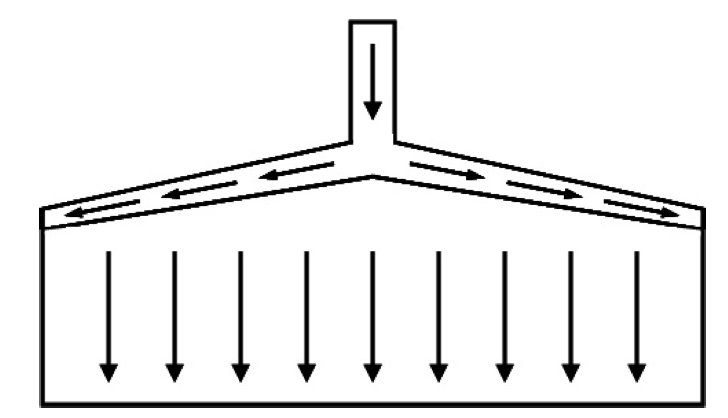
Figure 3. A schematic diagram showing the flow through a coathanger die geometry.
Figure 3 shows how the flow enters the distribution
manifold at the top and then is distributed across the die
width and then flows downward through the land region.
Attached to the exit of the feedblock were coathanger
style dies containing different cross-sectional geometries in
their distribution manifolds. These geometries are shown
schematically in Figure 4.
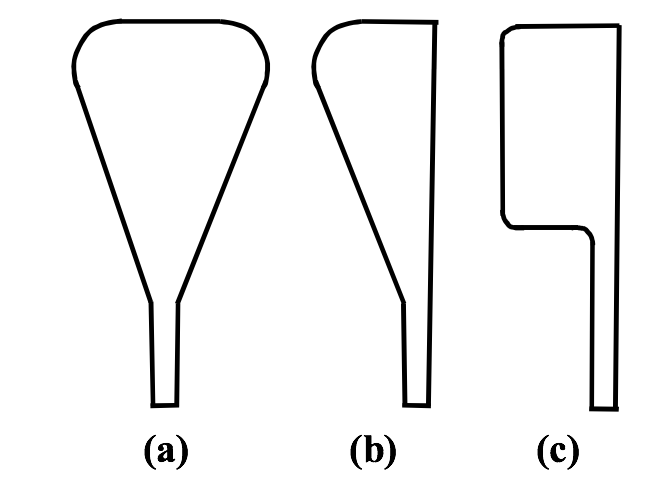
Figure 4. Coathanger die manifold cross-sectional geometries.
Figure 4a shows a teardrop shaped manifold geometry
commonly used in many coathanger style dies. This
geometry is symmetric about its vertical centerline. Figure
4b shows a half teardrop shaped manifold geometry. This
type of geometry is not symmetric about its vertical
centerline. This type of manifold is used when a
streamlined design is desired but when only one face of the
die is machined with a distribution manifold. This is more
common when machining a blow molding head or a blown
film die. Figure 4c shows a manifold geometry that is
rectangular in shape and has no taper at the bottom of the
channel. This manifold is highly asymmetric about its
vertical centerline and not well streamlined. These three
manifold geometries allowed us to study the symmetry
effects on the flow and distribution of coextruded
structures.
For a typical experiment, the coextrusion line was run
for 30 minutes to ensure that steady-state conditions had
been reached. The experiments were run at a temperature
of 215ºC and an extrusion rate of 9.0 kg/h. When steady
state was reached, the extruders were stopped
simultaneously and the coextruded material was cooled
while still in the die channel, solidifying the material. After
it had cooled to room temperature, the polymer “heel” was
removed from the die and cut into sections to expose the
cross-sectional faces along the die. This procedure allowed
the major deformations of the interfaces to be examined.
Results
The experimental setup shown in Figure 2 was first run
with an 8 inch wide coathanger die containing the crosssectional
geometry shown in Figure 4a. The frozen heel
produced in this experiment is shown in Figure 5. Figure
5a shows the die heel top surface as it was removed from
the die while 5b shows the die bottom surface labeled
where it will be cut into sections to expose the crosssectional
faces along and across the die.
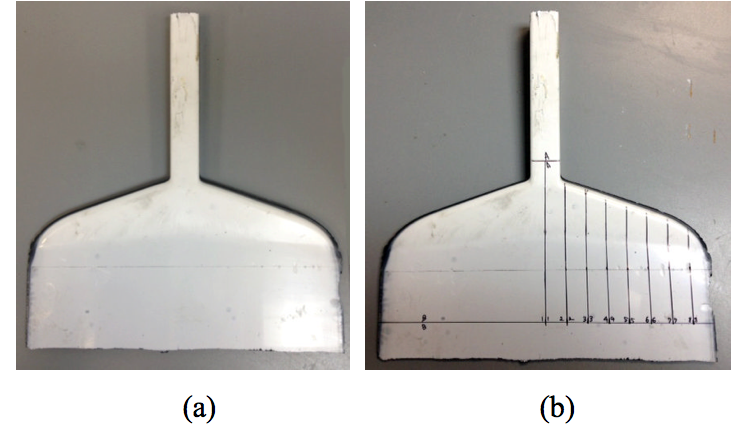
Figure 5. “Frozen” heel from the die with a symmetrical manifold geometry similar to the diagram in Figure 4a. The top (a) and bottom (b) surfaces are shown.
The initial experiments using the die with the
symmetric manifold were run with a three layer structure
with the skins pigmented white and the core pigmented
black so that the interface locations could be determined.
Figure 6 shows a cross-sectional cut of the three layer
structure before it enters the die distribution manifold.
This Figure shows that the entering structure is symmetric
and the layers are fairly uniform in thickness. The
uniformity of these layers has been slightly affected by the
highly viscoelastic properties of this polystyrene resin, as
has been discussed previously (11-21). However, for the
purposes of this study, these slight non-uniformities were
thought to have little impact on the results of these
experiments.
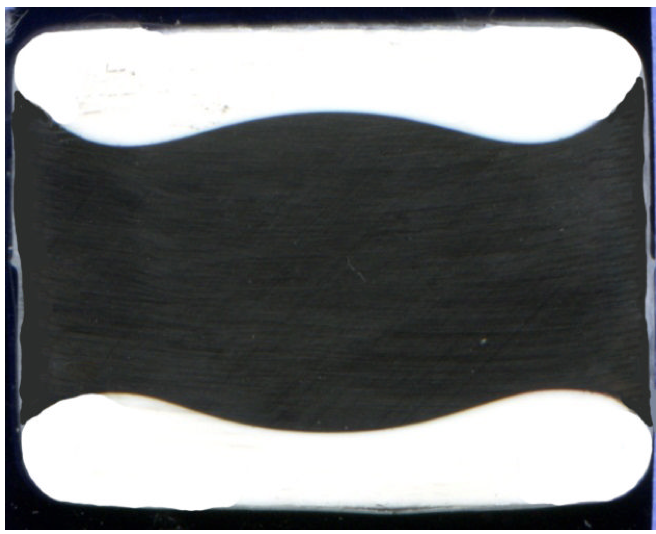
Figure 6. The three layer structure prior to entering the die distribution manifold.
Figure 7 shows the cross-sectional cuts for a 3 layer
structure in the symmetrical die manifold. The image on
the far left is near the centerline of the die and the image on
the far right is near the edge of the die. These images show
the progression of the layer interface locations as the structure flows down the distribution manifold from left to
right.

Figure 7. Cross-sectional cuts for a 3 layer structure in a symmetrical manifold. Flow progresses down the channel from left to right with the image on the left taken from near the center of the die and the image on the right taken from near the edge of the die.
Note in Figure 7 that the thicknesses of the skin layers
remain relatively constant as the structure flows down the
distribution manifold.
Figure 8 shows the relative thicknesses of the skin and
core layers from the left to the right edge of the die in the
land region. In this Figure, the core is shown in black and
the skins in white. This Figure shows that the skin layer
thicknesses are fairly uniform across the width of this
structure. When this same experiment was done with a 200
layer sample, the results were very similar.
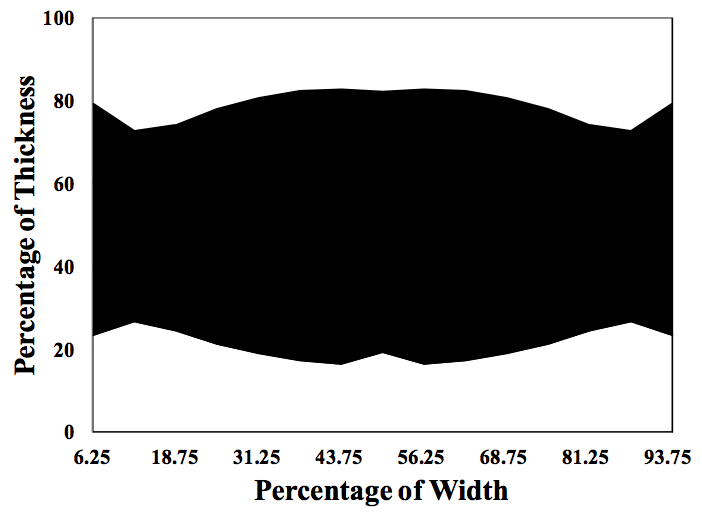
Figure 8. Skin and core layer thicknesses across the width of the die land for a 3 layer structure in a symmetrical manifold.
The next experiment consisted of running the three
layer sample through the half teardrop asymmetric die
manifold shown in Figure 4b. The 10 inch wide frozen
heel produced in this experiment is shown in Figure 9.
Figure 9a shows the die heel top surface as it was removed
from the die while 9b shows the bottom surface. This
Figure shows that the distribution manifold is cut only in
the top surface as was shown in Figure 4b.
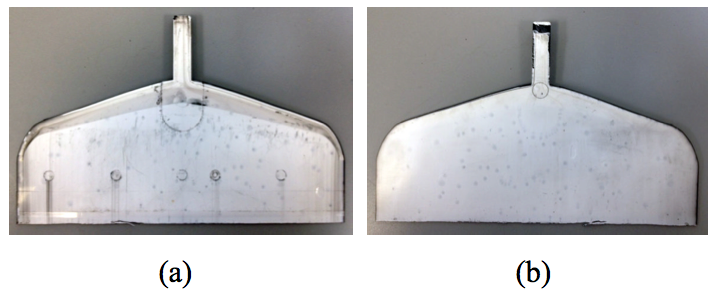
Figure 9. “Frozen” heel from the die with an asymmetrical half teardrop manifold geometry similar to the diagram in Figure 4b. The top (a) and bottom (b) surfaces are shown.
Figure 10 shows the cross-sectional cuts for a 3 layer
structure in the half teardrop asymmetrical die manifold.
These images show the progression of the layer interface
locations as the structure flows down the distribution
manifold from left to right.

Figure 10. Cross-sectional cuts for a 3 layer structure in a half teardrop asymmetrical manifold. Flow progresses down the channel from left to right with the image on the left taken from near the center of the die and the image on the right taken from near the edge of the die.
Figure 11 shows the relative thicknesses of the skin
and core layers from the left to the right edge of the die in
the land region. This Figure shows that the bottom skin
layer thickness is fairly uniform across the width of this
structure, although the center is slightly thicker than the
edges. However, the top skin layer, which is the side of the
die in which the distribution manifold was cut, shows
significantly more asymmetry with the layer being thinner
near the center and thicker at the edges of the die.
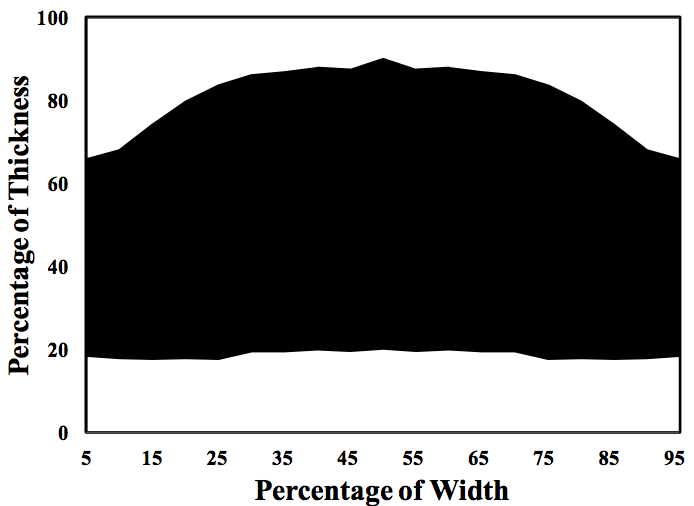
Figure 11. Skin and core layer thicknesses across the width of the die land for a 3 layer structure in a half teardrop asymmetrical manifold.
When this same experiment was done with a 200 layer
sample, the results were very similar. However, running a
200 layer sample does yield more information on the flow
of the layers compared to a 3 layer sample. Figure 12
shows an example of a 200 layer sample from near the
center of the half teardrop distribution manifold. The black
layers in the image are actually bands of 25 alternating
black and white layers but they are too small to see in this
picture. However, the thicker white layers between the 25
layer bands are visible and show the paths that the layers
take as they flow (from right to left in this image) from the
distribution manifold and down through the land region.

Figure 12. A cross-sectional view of the two hundred layer structure near the center of the die with the half teardrop distribution manifold.
Figures 10 through 12 all show that the slight amount
of asymmetry in the half teardrop distribution manifold
affected the distribution of the layer thicknesses in this
structure. Comparing Figure 8 for the symmetrical
manifold and Figure 11 for the half teardrop manifold also
shows this affect. It appears that the asymmetry causes
more of the top skin to flow down the distribution manifold
rather than flowing down towards the land. This causes the
top skin layer to be thinner near the center of the die and
thicker near the edge, as is shown in Figure 11.
The next experiment consisted of running the three
layer sample through the rectangular asymmetrical die
manifold shown in Figure 4c. The 10 inch wide frozen
heel produced in this experiment is shown in Figure 13.
Figure 13a shows the die heel top surface as it was
removed from the die while 13b shows the bottom surface.
Note that the bottom surface is completely white while the
top surface is white in the distribution manifold and the
edges of the land but black in the middle of the land area.
This is significantly different than the white surfaces shown
in Figure 5 for both surfaces of the heel produced using the
symmetric die manifold
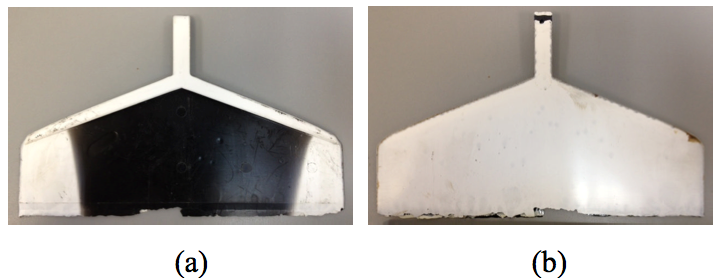
Figure 13. “Frozen” heel from the die with an asymmetrical rectangular manifold geometry similar to the diagram in Figure 4c. The top (a) and bottom (b) surfaces are shown.
Figure 14 shows the cross-sectional cuts for a 3 layer
structure in the rectangular asymmetrical die manifold.
These images show the progression of the layer interface
locations as the structure flows down the distribution
manifold from left to right.
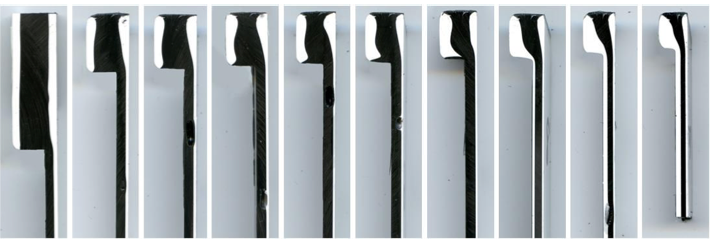
Figure 14. Cross-sectional cuts for a 3 layer structure in a rectangular asymmetric manifold. Flow progresses down the channel from left to right with the image on the left taken from near the center of the die and the image on the right taken from near the edge of the die.
Figure 15 shows the relative thicknesses of the skin
and core layers from the left to the right edge of the die in
the land region. In this Figure, the core is shown in black
and the skins in white. This Figure shows that the skin
layer thicknesses are very non-uniform across the width of
this structure. Note that the skin layer on the bottom is
thicker in the center and thinner on the edges. The top skin
layer by comparison is even more asymmetrical than the
bottom skin layer. The top skin layer is non-existent in the
center of the sample but it becomes very thick at the edges
of the die. When this same experiment was done with a
200 layer sample, the results were very similar.
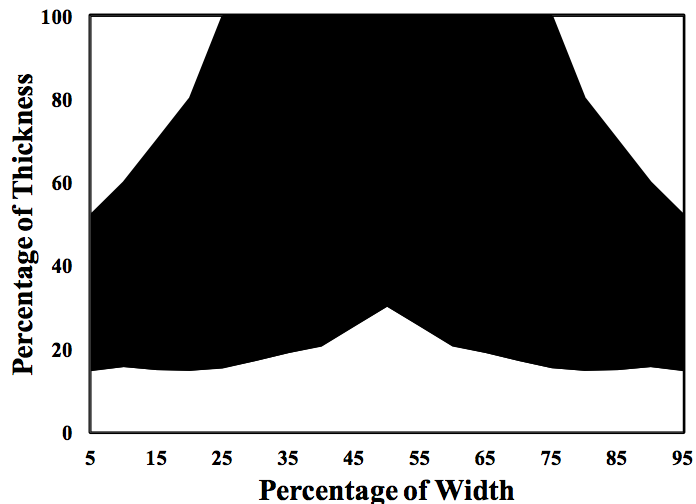
Figure 15. Skin and core layer thicknesses across the width of the die land for a 3 layer structure in a rectangular asymmetrical manifold.
Figures 13 through 15 all show that the large amount
of asymmetry in the rectangular distribution manifold
affected the distribution of the layer thicknesses in this
structure. Comparing Figure 8 for the symmetric manifold,
Figure 11 for the half teardrop manifold, and Figure 15 for
the rectangular manifold shows that as the level of
asymmetry of the distribution manifold increases, the nonuniformity
of the layer distribution also increases. It
appears that as the asymmetry of the distribution manifold
increases, more of the skin layers flow down the
distribution manifold rather than flowing towards the land.
This causes the skin layers to be thinner near the center of
the die and thicker near the edge.
Numerical
In order to better understand the flow patterns in the
various die geometries and how they affected the layer
distributions, numerical models were developed using
Computation Fluid Dynamics (CFD) techniques. ANSYS
Polyflow© [22], a three dimensional (3D) finite element
program, was used to model the flow through coathanger
die geometries with distribution manifolds similar to those
shown in Figure 4.
Simulation of the flow of fluid in a die involves the
numerical solution of the equations governing viscous fluid
flow on the specified computational domain, subject to the
stated boundary conditions. Steady, laminar flow of an
isothermal, incompressible, non-Newtonian fluid, such as
that in a coathanger die, can be described by the following
forms of the equations of continuity and motion:

where P, u , p, and τ are the density, velocity vector,
pressure, and deviatoric stress tensor, respectively.
Equation (2) shows the equation of motion in stressdivergence
form. This is the form typically used for flows
involving non-Newtonian fluids, as it properly accounts for
the spatial variation of viscosity.
In order to solve these equations for polymer flow, an
appropriate rheological constitutive equation must be
determined. In this study, a Carreau-Yasuda model was
used. The Carreau-Yasuda model is one of several
different generalized non-Newtonian viscosity models
which can be used to describe the shear rate dependence of
a polymer's viscosity. Because of its flexibility, the model
has proven useful in describing the rheological behavior of
a variety of polymers.
Figure 16 shows a discretized flow domain, or mesh,
for a coathanger die with a rectangular, asymmetrical
distribution manifold. This Figure shows that flow through
only half of the die was simulated due to the symmetry of
the model about the center plane. This mesh was used with
appropriate boundary conditions and constitutive equations
to determine the 3D flow fields within the die.
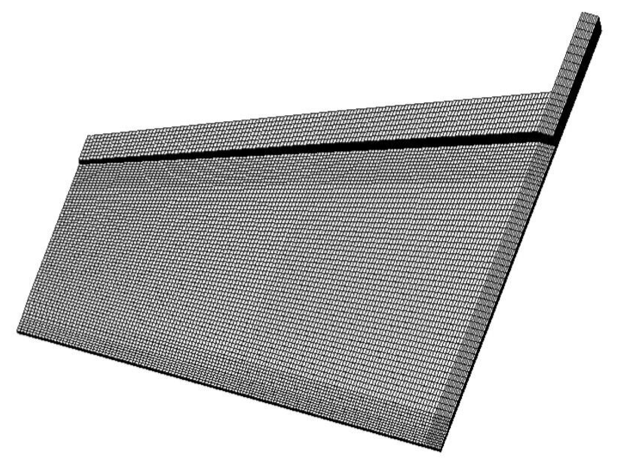
Figure 16. Finite element mesh for a rectangular asymmetrical manifold.
Figure 17 shows a particle path plot for the die with
the rectangular, asymmetrical distribution manifold shown
in Figure 16. In this plot, a series of equally spaced,
massless particles are placed at the upper (17a) and lower
(17b) interface locations between the skin and core layers
near the entry to the distribution manifold and allowed to
flow through the geometry and indicate the subsequent
locations of those interfaces. This Figure shows that the
upper skin layer (17a) does not flow down to the land
immediately but moves a significant distance down the
distribution manifold before it enters the land region. The
lower interface (17b) follows a more normal flow path
which distributes the interface across the width of the die.
The results of these plots agree with the experimental
results shown in Figures 13 through 15.
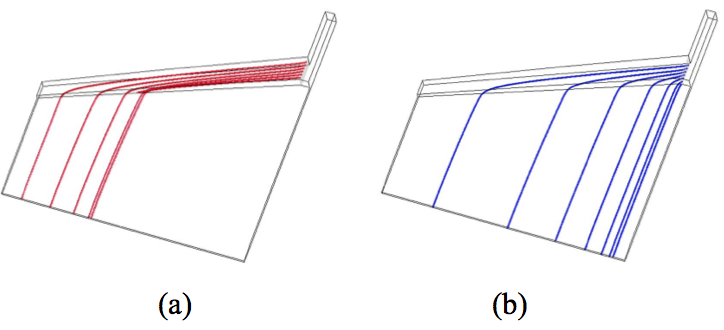
Figure 17. Particle path plots tracing the upper (a) and lower (b) interface locations in a 3 layer structure in a rectangular asymmetrical manifold.
The next geometry simulated was similar to Figure 16
but a 45 degree taper was added to the exit of the
distribution manifold. This creates geometry similar to the
half teardrop geometry shown in Figure 4b. Figure 18
shows a particle path plot for the die with the half teardrop,
asymmetrical distribution manifold. In this plot, a series of
equally spaced, massless particles are placed at the upper
(18a) and lower (18b) interface locations between the skin
and core layers near the entry to the distribution manifold
and allowed to flow through the geometry and indicate the
subsequent locations of those interfaces. This Figure
shows that the upper skin layer (18a) does not flow down
to the land immediately but moves a significant distance
down the distribution manifold before it enters the land
region. The lower interface (18b) follows a more normal
flow path which distributes the interface across the width of
the die. The results of these plots agree with the
experimental results shown in Figures 9 through 11.
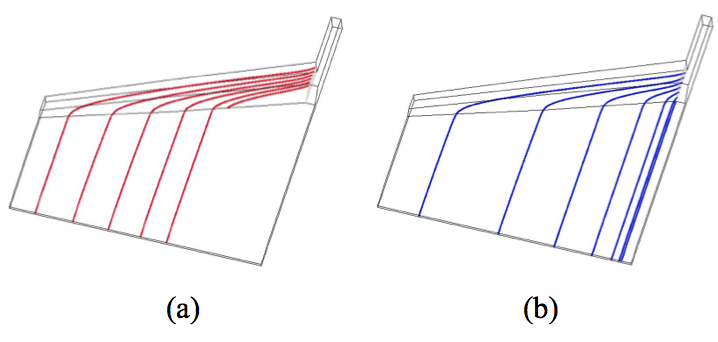
Figure 18. Particle path plots tracing the upper (a) and lower (b) interface locations in a 3 layer structure in a half teardrop asymmetrical manifold.
Comparing Figures 17 and 18 shows that the lower
skin layer interfaces are fairly similar but the upper skin
interfaces are different. The half teardrop manifold
geometry is slightly more symmetrical than the rectangular
manifold geometry and so the upper skin interface begins to flow down into the land region sooner giving a
somewhat more uniform layer distribution across the die.
The next geometry to be simulated was similar to
Figure 18 but mirrored about the axis of the surface
opposite the distribution manifold. This creates geometry
similar to the symmetrical teardrop geometry shown in
Figure 4a. Figure 19 shows particle path plots for the die
with this distribution manifold geometry. In this plot, a
series of equally spaced, massless particles are again placed
at the upper and lower interface locations between the skin
and core layers near the entry to the distribution manifold
and allowed to flow through the geometry and indicate the
subsequent locations of those interfaces. This Figure
shows that the upper and lower skin layers flow uniformly
across the die, which is expected because of the symmetry
of this geometry. In fact, Figure 19b shows that if the
results are viewed from the front of the manifold, the
particle paths for the upper and lower skin interfaces are
identical and appear as single lines. The results of these
plots agree with the experimental results shown in Figures
5 through 8.
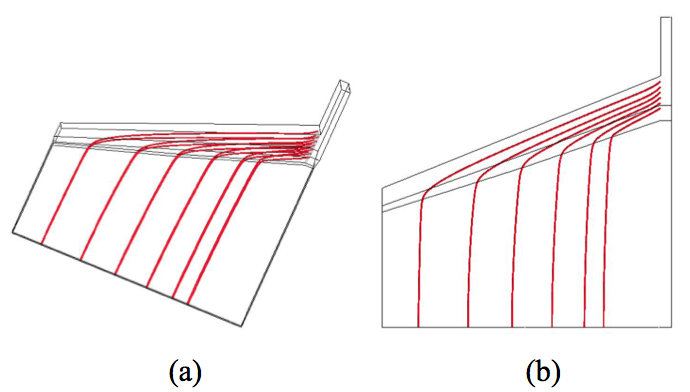
Figure 19. Particle path plots showing the upper and lower interface locations in a 3 layer structure in a symmetrical teardrop manifold, where (a) and (b) show different viewing angles of the final results.
Conclusions
A unique series of experiments and numerical
simulations were conducted to determine the effect of die
manifold channel symmetry on the flow of coextruded
structures through coathanger style dies. Experimental and
numerical data were developed on the layer uniformity of
coextruded structures which were processed through
several different die manifold channels containing different
levels of symmetry. As the asymmetry of the die manifold
increases, more of the skin layers on the manifold side flow
down the distribution manifold rather than flowing towards
the land. This causes the skin layers to be thinner near the
center of the die and thicker near the edge. The data show
that as the asymmetry of the distribution manifold
increases, the layer uniformity of the coextruded structure
decreases.
References
1. L.M. Thomka and W.J. Schrenk, Modern Plastics, 49,
4, 62 (1972).
2. C.D. Han, J. Appl. Poly. Sci., 19, 7, 1875 (1975).
3. W.J. Schrenk, Plastics Engineering, 30, 3, 65 (1974).
4. J.A. Caton, British Plastics, 44, 3, 95 (1971).
5. L.M. Thomka, Plastics Engineering, 18, 2, 60 (1973).
6. C.R. Finch, Plastics Design Forum, 4, 6, 59 (1979).
7. C.I. Chung and D.T. Lohkamp, Modern Plastics, 53,
3, 52 (1976).
8. H.H. Winter and H.G. Fritz, Polymer Engineering and
Science, 26, 543 (1986).
9. Y. Matsubara, Polymer Engineering and Science, 19,
169 (1979).
10. J. Dooley, SPE-ANTEC Technical Papers, 36, 168
(1990).
11. J. Dooley and B.T. Hilton, Plastics Engineering, 50,
2, 25 (1994).
12. J. Dooley and L. Dietsche, Plastics Engineering, 52,
4, 37 (1996).
13. J. Dooley and K. Hughes, TAPPI Journal, 79, 4, 235,
(1996).
14. B. Debbaut, T. Avalosse, J. Dooley, and K. Hughes,
Journal of Non-Newtonian Fluid Mechanics, 69, 2-3,
255 (1997).
15. J. Dooley, K.S. Hyun, and K.R. Hughes, Polymer
Engineering and Science, 38, 7, 1060 (1998).
16. B. Debbaut and J. Dooley, Journal of Rheology, 43, 6,
1525 (1999).
17. P.D. Anderson, J. Dooley, and H.E.H. Meijer, Applied
Rheology, 16, 4, 198 (2006).
18. P. Yue, J. Dooley, and J. Feng, Journal of Rheology,
52, 1, 315 (2008).
19. P. Yue, C. Zhou, J. Dooley, and J. Feng, Journal of
Rheology, 52, 4, 1027, (2008).
20. J. Dooley, “Viscoelastic Effects in Melt Flow,”
Chapter 8, in Extrusion of Polymers - Theory and
Practice (2nd Edition), Hanser (2010).
21. P. Lee and J. Dooley, TAPPI, Polymers, Laminations,
Adhesives, Coatings, & Extrusions Conference,
Seattle, WA, Paper 10-2 (2012).
22. ANSYS, Inc., 275 Technology Drive, Canonsburg,
PA, 15317, USA, www.ansys.com.
Keywords: Coextrusion, die design, symmetry, distribution
manifold, layer uniformity, CFD.
Return to
Paper of the Month.