Viscoelastic Properties of CNT-PC Compounds: Effect of Compounding Method, CNT Type and Testing Protocol
E. Ray Harrell, Polymer Diagnostics Incorporated
Joseph C. Golba, Jr., Jill Kunzelman and Jane M. Spikowski, PolyOne Corporation
Avon Lake, OH 44012 Abstract
Frequency-dependent viscoelastic properties are used
to elucidate the relationships among the method of
compounding, the types of carbon nanotubes (CNT) used
within the CNT-polycarbonate composite, the changes in
structure (CNT-polycarbonate interaction) and molecular
weight of the base polycarbonate. CNT-polycarbonate
interaction increases with increasing CNT content and
CNT aspect ratio. Addition of the CNT to a TSE at entry
ports after attainment of a polycarbonate melt provides
higher CNT-polycarbonate interaction. Increasing twin
screw extruder residence time by using multiple passes
significantly decreases the molecular weight of the
polycarbonate within the CNT-polycarbonate composite.
This effect is attributed to chain-scission that is intensified
by the presence of the CNT-polycarbonate interaction.
Introduction
Considerable activity has been focused on the
development of carbon nanotube-polymer composites.
One area of focus is the attainment of adequate dispersion
of the CNT within the polymer matrix. Various
composite properties, such as electrical resistivity and
viscoelastic properties, have been used to assess the stateof-mix
and dispersion of the CNT within a base polymer
[1, 2].
From a product commercialization perspective the
most widely used dispersion processing technology for the
production of filled polymer materials is melt
compounding. And, of the various types of melt
compounding equipment, the twin screw extruder (TSE)
dominates the field. So, as expected, much of the
dispersion processing for nanocomposite production has
focused on melt compounding via twin screw extrusion.
Some of the earliest work focused on montmorillonite
clay based nanocomposites. These studies focused on the
effect of operating conditions [3, 4] as well as process
configuration [5]. It was determined that to generate
acceptable dispersions that yielded attractive properties it
was necessary to strike a balance of the environmental
conditions in the compounding process, i.e., shear forces,
residence time, and mixing energy input. More recent
work that focused on CNT-based composites also
considered the influence of operating conditions and
process configuration [6-10]. The results of these studies paralleled those of the work on dispersing nanoclays in
polymer matrices. An optimum blend of shear forces,
residence time and mixing energy needs to be struck to
enable the production of high performance
nanocomposites.
This paper extends this field of activity and examines
the cause-and-effect relationships among the method of
compounding, the types of CNT and polycarbonate used,
and the composite formulation with the linear and nonlinear
viscoelastic properties of the nanocomposites
produced.
Experimental
A Leistritz ZSE 18 HP co-rotating, intermeshing twin
screw extruder (TSE) equipped with screws 18mm in
diameter and 60 L/D in process length was used to melt
compound the nanocomposites described in this study.
This 12 barrel extruder was configured with K-Tron lossin-weight
feeders at barrel sections #1 (primary feed port)
and #5 (downstream feed port using either a top entry port
or a side feeder) to dose materials into the melt
compounding process. A port for vacuum venting of
residual volatiles was provided at barrel #11. Two screw
configurations were used. Intensive as well as mild
mixing screws were used for primary melt compounding
of the nanocomposites. In addition, the mild mixing screw
was used for exposing compounded nanocomposites to
extended melt residence times under relatively mild
extrusion conditions. The process and screw
configurations are represented schematically in Figure 1.
CNT-polycarbonate nanocomposites were formulated
with three different grades of multi-wall CNT and two
different grades of polycarbonate. The identification of
these materials and their defining characteristics are
articulated in Tables 1 and 2. CNT content was varied
between 1 and 7 weight percent. The melt compounding
process for the production of the CNT-polycarbonate
nanocomposites was varied with respect to screw design
(mentioned above) and CNT dosing location (either with
the solid resin at barrel #1 or into a fully developed
polycarbonate melt at barrel #5). Process conditions for
the primary melt compounding operations were
maintained at a resin throughput rate of 6.8 kg/hr, a screw
speed of 900 rpm and a maximum barrel set temperature
of 300°C. Process conditions for exposing the
nanocomposites to extended melt residence times included throughput rates of 2.3 and 6.8 kg/hr, a screw
speed of 600 rpm, and a maximum barrel set temperature
of 300°C. For most of these extrusion operations the
atmosphere at the feed ports was ambient air. However for
selected operations a nitrogen "blanket" was maintained at
the feeder hoppers and the extruder dosing ports. In all
cases the polycarbonate resins were dried at 121°C for a
minimum of 4 hours prior to melt compounding.
A TA Instruments ARES G2, equipped with 25 mm
diameter oscillating parallel plates, was used to measure
the strain amplitude-, frequency- and time-dependent
viscoelastic properties of the polycarbonate resins and
CNT-polycarbonate compounds. All testing involved a
1.5 minute preheat and a dry nitrogen environment at
235°C. Resin and compound samples were vacuum-dried
at 121°C for a minimum of 12 hours, after which they
were retained under vacuum at room temperature until
consumed for testing. Disk-shaped test specimens were
die-cut from 1.6 mm thick sheets prepared by
compression-molding the samples between Teflon-coated
aluminum foil in a laminating press at 210°C for 15
seconds total and immediately loaded into the parallel
plate test fixture.
Strain-dependent viscoelastic properties were
measured for shear strain-amplitudes of 0.04 to 400% to
define the strain-limit for linear viscoelastic (LVE)
behavior. Frequency-dependent LVE properties were
measured for a frequency range of 316 to 0.0562 rad/s,
requiring approximately 10 minutes to complete, followed
by a second, sequential frequency scan from 316 to 0.1
rad/s, requiring approximately 6 minutes to complete.
The dual-scan methodology was used to assess thermal
stability of the sample. Time-dependent LVE properties
were measured at 1 rad/s for a residence time of 23
minutes.
Results and Discussion
CNT Concentration
Figure 2 displays an example of the effect of CNT
content on the frequency-dependent complex viscosity of
CNT1-PC1 blends. Low-frequency viscosity increases
with increasing CNT1 content. High-frequency complex
viscosity initially decreases and then increases with
increasing CNT1 content. The initial decrease in the
high-frequency viscosity is attributed to a slight decrease
in molecular weight of polycarbonate PC1 during
compounding.
Figure 3 displays the accompanying Cole-Cole plots.
This method of presentation for the viscoelastic properties
(i.e. loss modulus, G”, vs. storage modulus, G’) “hides”
variations in molecular weight but sensitively reveals
variations in structure that arise from molecular branching, multiple phase morphology, crystallinity and
reinforcing filler-polymer interactions [11]. As shown,
the Cole-Cole plot shifts towards higher storage moduli or
higher elasticity with increasing CNT1 content,
attributable to an increase in CNT-polycarbonate
interaction. This is in contrast to the effect of increasing
the content of non-interacting filler which would shift the
Cole-Cole plot diagonally along the dashed, equal-moduli
line.
The change in the LVE properties during the
approximately 10 minutes of time between frequency
scans is displayed in Figures 4 and 5. The complex
viscosity increases (especially at low-frequencies) and the
Cole-Cole plots shift towards higher storage modulus,
indicating that the CNT-polycarbonate interaction
increases during the relatively quiescent (exposure to
small cyclic strain) residence time under nitrogen at
235°C. The dynamics of the change in properties needs
further study, as will be presented.
CNT Type
The effect of variation in CNT type on the
enhancement of complex viscosity and elasticity is shown
in Figures 6 and 7. Increases in the levels of CNT1 and
CNT3 in polycarbonate PC1 produce similar increases in
complex viscosity and structure. However, CNT2
provides enhancements that are nearly equivalent to those
produced with the addition of an extra 2% of CNT1 or
CNT3. As shown in Table 1, the aspect ratio
(length/diameter) of CNT2 is approximately 3 times that
of the other two CNT types. Apparently, the differences
in aspect ratios are maintained during compounding and
provide the differentiation in the CNT-polycarbonate
interaction; larger aspect ratios of the CNT produce larger
viscosity and elasticity enhancements.
Process Variations
During the course of this study, the effects of the TSE
screw configuration (regular, mixing vs. mild,
conveying), location of CNT addition (main feed, side
feed or top feed) and type of “blanket” gas used on the
feed ports (ambient air or dry nitrogen) on the viscoelastic
properties were examined. Figures 8, 9 and 10
summarize the results in terms of low-frequency complex
viscosity, structural parameter and high-frequency
complex viscosity, respectively, as functions of CNT
content. The structural parameter is somewhat arbitrarily
defined as the storage modulus, corresponding to a
constant loss modulus of 2x10
4 Pa. The low-frequency
complex modulus and the structural parameter plots
reveal similar trends, owing to the feature that both
variables have a strong dependence on structure or the
magnitude of CNT-polycarbonate interaction. As
previously concluded, CNT2 develops higher amounts of CNT-polycarbonate interaction (positive reinforcement)
than do CNT1 and CNT3 for all levels of CNT addition.
The compounds that were produced with the addition
of the CNT to the main feed port (along with the
polycarbonate resin pellets) tend to have lower low frequency
complex viscosity and structural parameters
than do the compounds produced with addition of the
CNT to the top and side feed port (where the
polycarbonate is in the melt state). Compounds produced
with CNT1 (and presumably, with CNT3, but to be
verified) display this trend for all levels of CNT
examined. Compounds produced with CNT2 display this
trend only for CNT content of 1.5% and lower. At higher
levels of CNT2, the dependence of properties on port of
addition is only slight. These features suggest that the
addition of the CNT to the main feed port leads to
attrition (a decrease in aspect ratio) of the CNT.
Additionally, the CNT2 might have a more stable
geometry than do the CNT1 and CNT3. Neither the
structural parameter nor the low-frequency complex
viscosity displays a significant effect of using nitrogen vs.
ambient air during the compounding.
The high-frequency complex viscosity data of Figure
10 are impacted by the variation in structure but the
relative relationships among the data with respect to
method of compounding are different than those observed
in Figures 8 and 9. The series of compounds prepared by
addition of the CNT to the main feed port with ambient
air and the use of a “mild” screw configuration produced
the lowest high-frequency viscosity. It is likely that the
magnitude of the high-frequency complex viscosity
reflects the molecular weight of the polycarbonate, in
addition to the amount of CNT-polycarbonate interaction.
Specifically, the variation in relative magnitude of the
high-frequency viscosity (for any given CNT content)
reflects the severity of the compounding process and the
accompanying change in the molecular weight of the base
PC. This postulate is supported by the results shown in
Figures 11 and 12, the complex viscosities and
accompanying Cole-Cole plots of polycarbonates PC1
and PC2 and their compounds with 3% CNT1. The
difference in the molecular weight of these
polycarbonates is readily revealed by the high-frequency
complex viscosities of the 3% CNT-polycarbonate
compounds. However, the low-frequency complex
viscosities and the Cole-Cole plots suggest that the 3%
CNT compound containing the lower molecular weight
polycarbonate PC2 possess a higher amount of CNTpolycarbonate
interaction (perhaps because of increased
rates of diffusion of the lower molecular weight
polycarbonate). Note that the difference in molecular
weight is “hidden” in the Cole-Cole plot.
Residence Time
It has been shown that the effect of quiescent
residence time at 235°C in an inert environment is to
increase CNT-polycarbonate compound viscosity and
CNT-polycarbonate interaction. This might indicate that
the inter-diffusion of the CNT with the polycarbonate has
not attained completion during the compounding
processes examined. An attempt was made to increase
the residence time during compounding by using multiple
passes of the 3% CNT-polycarbonate compounds through
the TSE equipped with the “mild” screw configuration.
Feed rates of 2.3 and 6.8 kg/hr were used with a screw
speed of 600 rpm. Compounds containing 3% CNT in
polycarbonate PC1 were subjected to three passes. An
example of the significant changes in frequencydependent
complex viscosity for the CNT1-PC1 sample is
shown in Figure 13. Viscosity of the compound
decreases, especially at high frequencies, with increasing
number of passes in the TSE.
Preliminary studies of TSE residence times, using
small quantities of color concentrates with the
polycarbonate PC1, indicate that the mode of the
residence time distribution for this resin was
approximately 30 s for the 6.8 kg/hr rate and 60 s for the
2.3 kg/hr rate. However, Figure 13 suggests that an
equivalent shear history was attained for the samples
exposed to the 3 passes at 6.8 kg/hr and to the 2 passes at
2.3 kg/hr. Although the frequency-dependent viscosity of
the 3% CNT-polycarbonate compound is significantly
different from that of the base polycarbonate (a feature
that likely affects TSE residence time) it is assumed that
the residence time for the compound was 30 s for a feed
rate of 6.8 kg/hr which translates to 45 s for a feed rate of
2.3 kg/hr. Figures 14 and 15 show the effect of residence
time within the TSE, equipped with the mild screw
configuration, on the structural parameter and high frequency
complex viscosity, respectively. For each of
the three CNT types, the 3% CNT-polycarbonate
undergoes an apparent decrease in structure, attainment of
a minimum then an increase with increasing TSE
residence time. These changes are accompanied by a
continuous decrease in polycarbonate molecular weight,
likely caused by chain-scission. The formation of CNT polycarbonate
interaction might act as a shear stress
concentrator or intensifier that enhances the rate of chain scission.
This postulate further suggests that the higher
negative slopes of the high-frequency viscosity vs.
residence time for the CNT2 and CNT3 containing
compounds reflects a stronger CNT-polycarbonate
interaction than is the case for CNT1-PC1. This is in
contrast to the very slight change in viscosity that occurs
with residence time for polycarbonate PC1 in the presence
of air or nitrogen blankets at the entry ports. The increase
in the structural parameter that is measured during the
second frequency-scan, relative to the magnitude
measured during the first frequency scan indicates that the
significant reduction in CNT-polycarbonate interaction (caused by the multiple passes within the shear
environment provided by the “mild” screw configuration)
can reform if provided a quiescent (low strain) recovery
time. However, the high-frequency viscosity reduction
during multiple passes does not significantly recover
during the two frequency scans. The creation of lower
molecular weight polycarbonate species and the
accompanying enhancement of diffusion into the CNT
could be the cause of the formation of the minima
observed in the structural parameter vs. TSE residence
time data, Figure 14.
Viscoelastic Property Considerations
The viscoelastic properties discussed thus far have
been LVE properties. Figures 16 and 17 display typical
changes in complex viscosity and loss tangent as
functions of shear strain amplitude, CNT content and
CNT type. Departure from zero indicates the strain-limit
for LVE behavior for a given compound at an angular
frequency of 1 rad/s. Figure 18 shows that the LVE
strain-limit for complex viscosity at an angular frequency
of 1 rad/s decreases with increasing CNT content. CNT2-
containing compounds display lower LVE strain-limits
than do the compounds containing the other two CNTs.
These trends suggest that the LVE strain-limit depends
upon the amount or strength of CNT-polycarbonate
interaction. Support for this postulate is provided by the
correlation between the LVE strain-limit and low frequency
complex viscosity, shown in Figure 19, where
CNT type and content become “hidden”, i.e. all the data
collapse onto a single curve. Although the trends for the
LVE strain-limit of the loss tangent are similar to those
shown for the complex viscosity LVE strain-limit, the
loss tangent is more sensitive to strain than is the complex
viscosity. Figure 20 reveals that LVE departure begins at
lower strains for the loss tangent than it does for the
complex viscosity. The features associated with LVE
strain-limits indicate complex behavior of CNT polycarbonate
compounds and the need to define and use
experimental protocols that produce LVE responses.
Conclusions
The frequency-dependent viscoelastic properties of
CNT-polycarbonate composites reveal that CNT provides
positive reinforcement of polycarbonate through the
formation of CNT-polycarbonate interaction. The CNT polycarbonate
interaction increases with increasing CNT
content and with increasing CNT aspect ratio. The
amount of CNT-polycarbonate interaction is also
influenced by the method of compounding. The addition
of the CNT with the polycarbonate pellets appears to
cause CNT attrition (perhaps by a decrease in the CNT
aspect ratio). Addition of the CNT to a TSE at ports after
a melt is attained provides higher CNT-polycarbonate
interaction. An increase in TSE residence time (through
the use of multiple passes) decreases the high-frequency
complex viscosity of CNT-polycarbonate compounds.
This feature is attributed to a decrease in polycarbonate
molecular weight via a chain-scission process that is
intensified by the presence of the CNT-polycarbonate
interaction.
References
1. I. Alig, T. Skipa, D. Lellinger, and P. Potschke,
Polymer, 49, 3524 (2008).
2. M.D. Via, F.A. Morrison, J.A. King J.A. Caspary,
O.P. Mills and G.R. Bogucki, J. Appl. Polym. Sci.,
121, 1040 (2011).
3. W. Lertwimolnun and B. Vergnes Polym. Eng. Sci.,
46, 314 (2006).
4. D. Homminga, B. Goderis, S. Hoffman, H. Reynaers,
and G. Groeninckx, Polymer, 46, 9941 (2005).
5. H.R. Dennis, D.L. Hunter, D. Chang, S. Kim, J.L.
White, J.W. Cho, and D.R. Paul, Polymer, 42, 9513
(2001).
6. W. Lertwimolnun and B. Vergnes, Polym. Eng. Sci.,
47, 2100 (2007).
7. B. Lin, U. Sundararaj, and P. Pötschke, Macrom.
Mater. Eng., 291, 227 (2006).
8. T. Villmow, P. Pötschke, S. Perel, L. Häussler, and B.
Kretzschmar, Polymer, 49, 3500 (2008).
9. P. Pötschke, S.M. Dudkin, and I. Alig, Polymer, 44,
5023 (2003).
10. T. Villmow, B. Kretzschmar, and P. Pötschke, Comp.
Sci. Technol., 70, 2045 (2010).
11. E.R. Harrell and N. Nakajima, J. Appl. Polym. Sci.,
29(3), 995 (1984).
Acknowledgements
The authors gratefully acknowledge the assistance
provided by Glenn Evans, Jr. in preparing the CNT-PC
compounds. The authors would also like to thank the
Ohio Department of Development for participating in the
funding of this project. Appreciation is also given to
PolyOne Corporation for permission to publish this paper.

Table 1. Description of CNT Materials

Table 2. Description of PC Materials
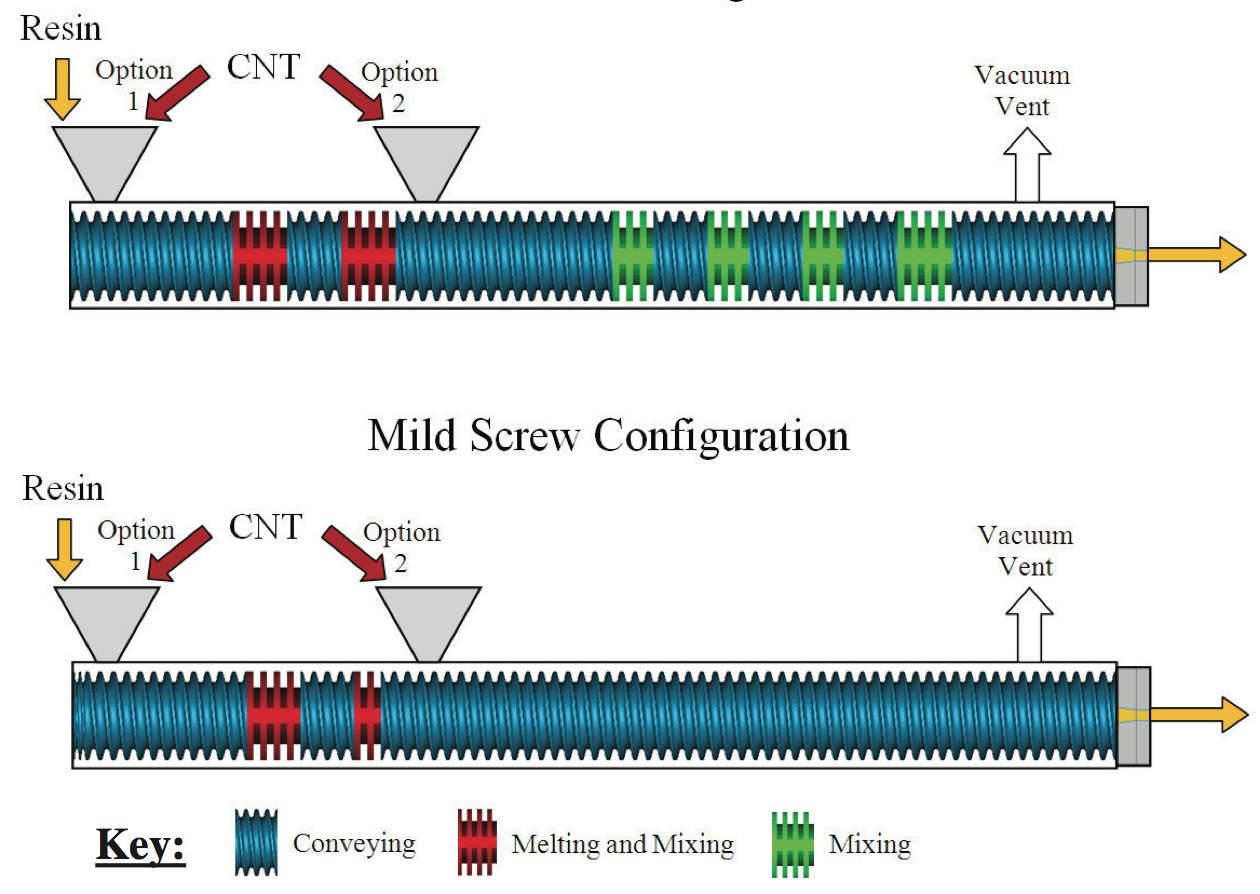
Figure 1. Schematic representation of the process configurations and screw designs.
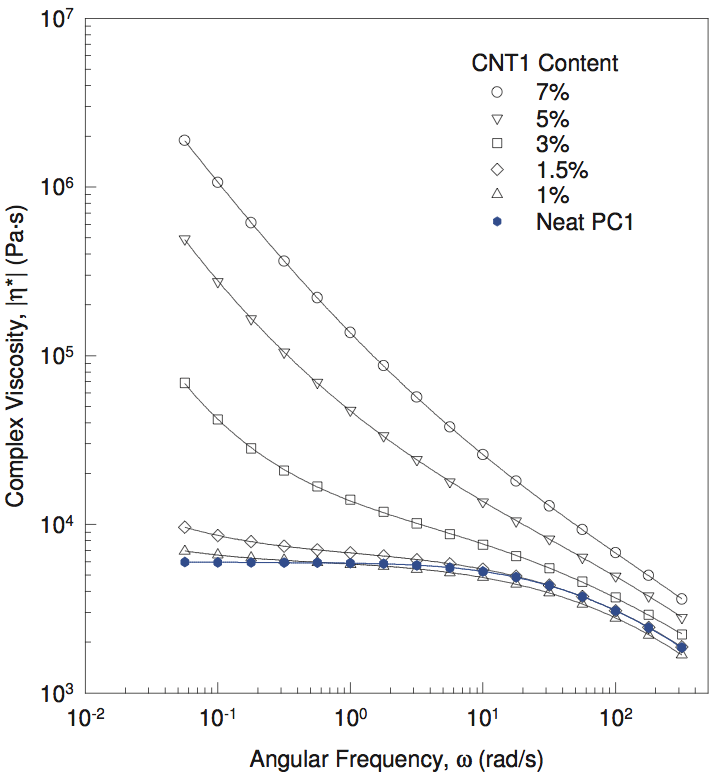
Figure 2. Complex Viscosity of CNT1-PC1 with CNT Addition at Main Feed, Intensive TSE Screw
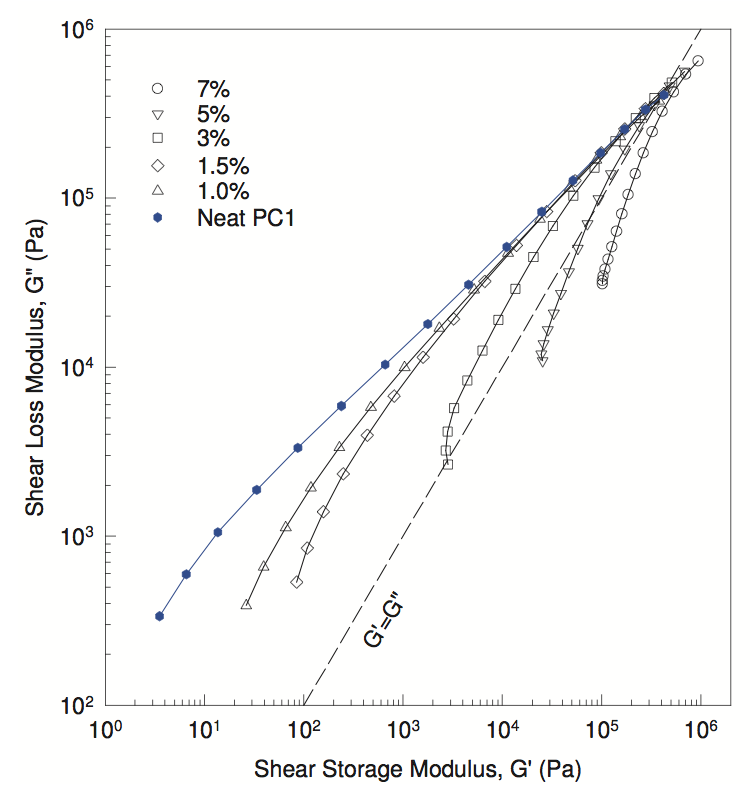
Figure 3. Cole-Cole Plots of CNT1-PC1 with CNT Addition at Main Feed, Intensive TSE Screw
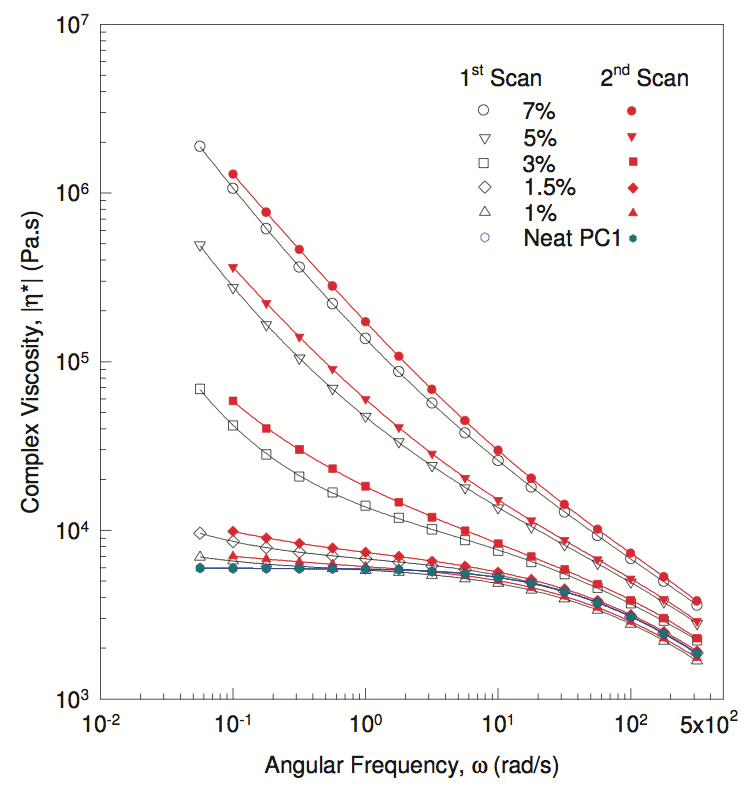
Figure 4. Change in Viscosity of CNT1-PC1 Compounds Between Frequency-Scans, CNT Addition at Main Feed, Intensive TSE Screw
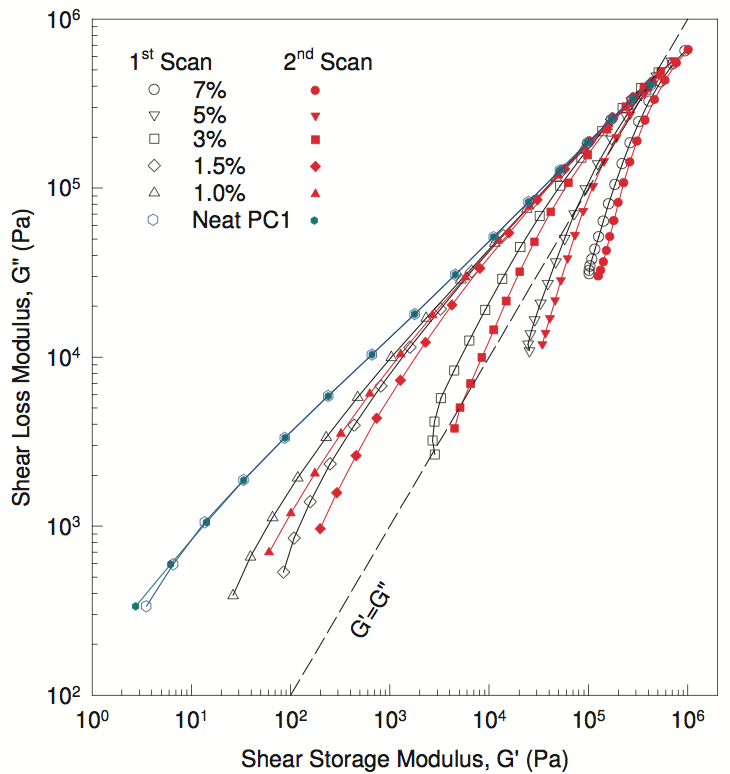
Figure 5. Change in Cole-Cole Plots of CNT1-PC1 Compounds Between Frequency-Scans, CNT Addition at Main Feed, Intensive TSE Screw
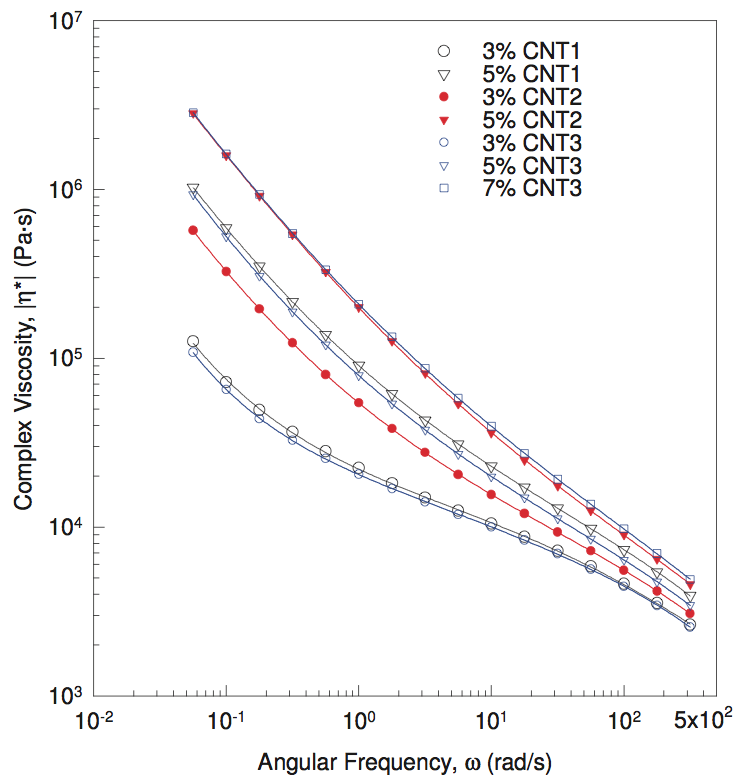
Figure 6. Effect of CNT-Type on the Complex Viscosity of CNT-PC1, Top Feed, Intensive TSE Screw
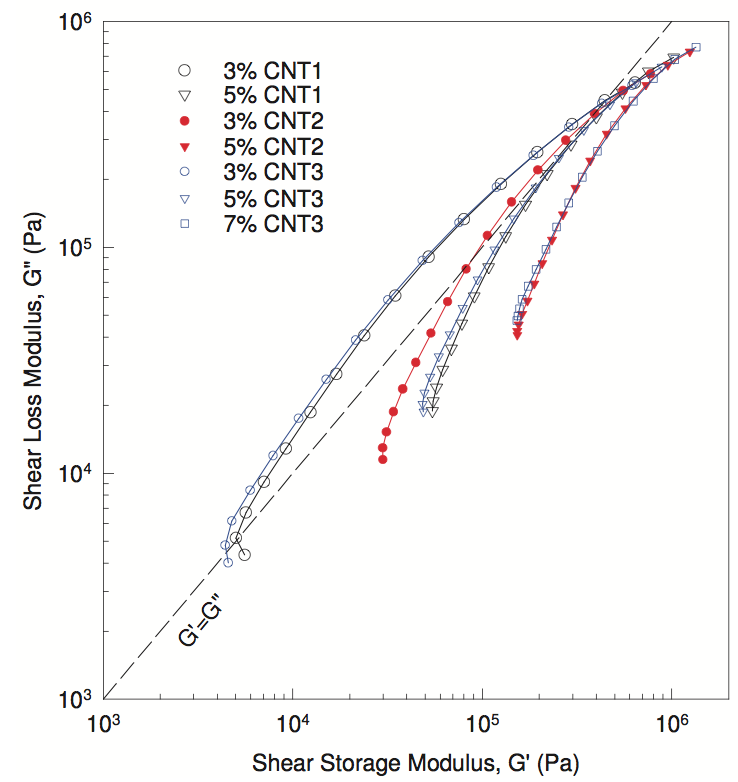
Figure 7. Effect of CNT-Type on the Cole-Cole Plots of CNT-PC1, Top Feed, Intensive TSE Screw
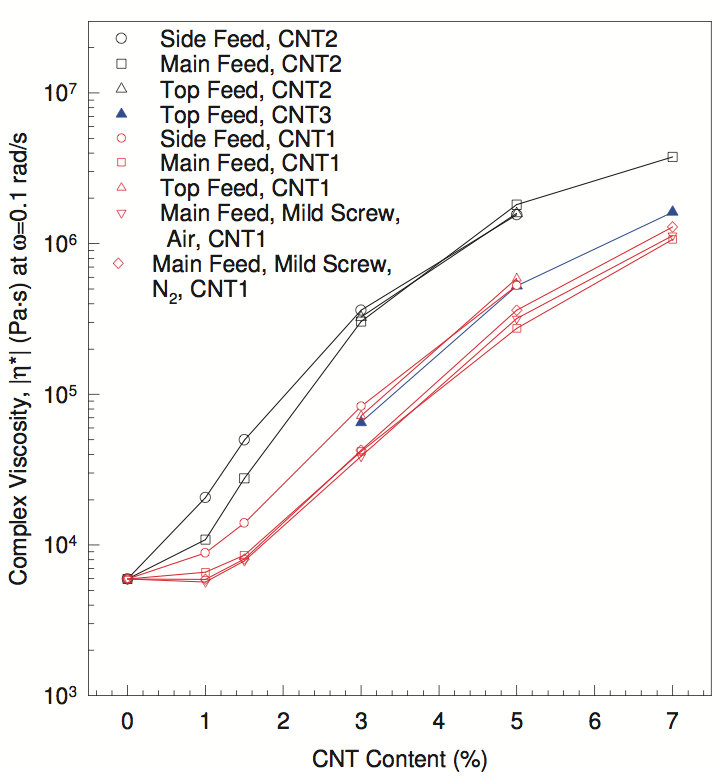
Figure 8. Low-Frequency Complex Viscosity of CNT-PC1 Compounds at 235°C
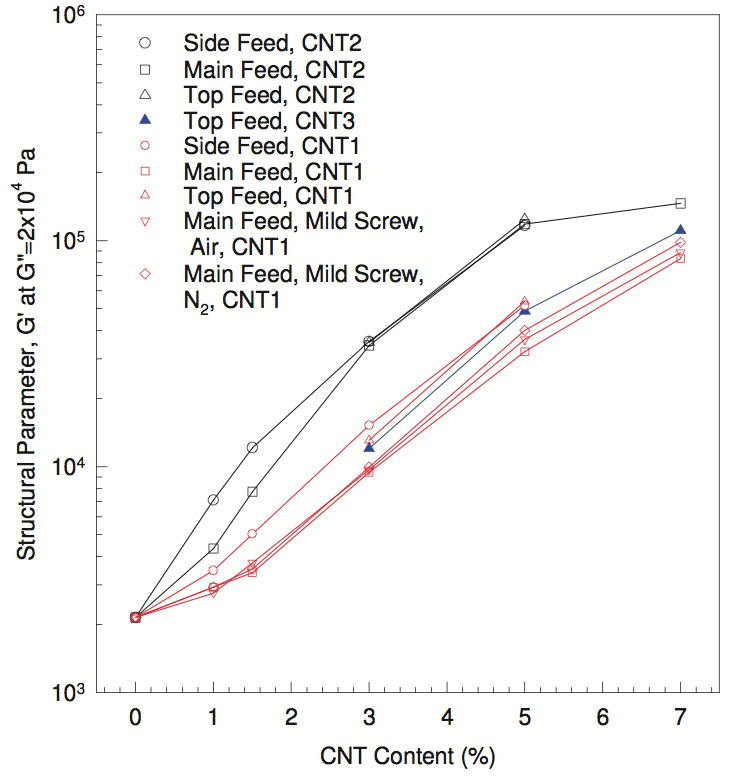
Figure 9. Structural Parameter of CNT-PC1 Compounds at 235°C
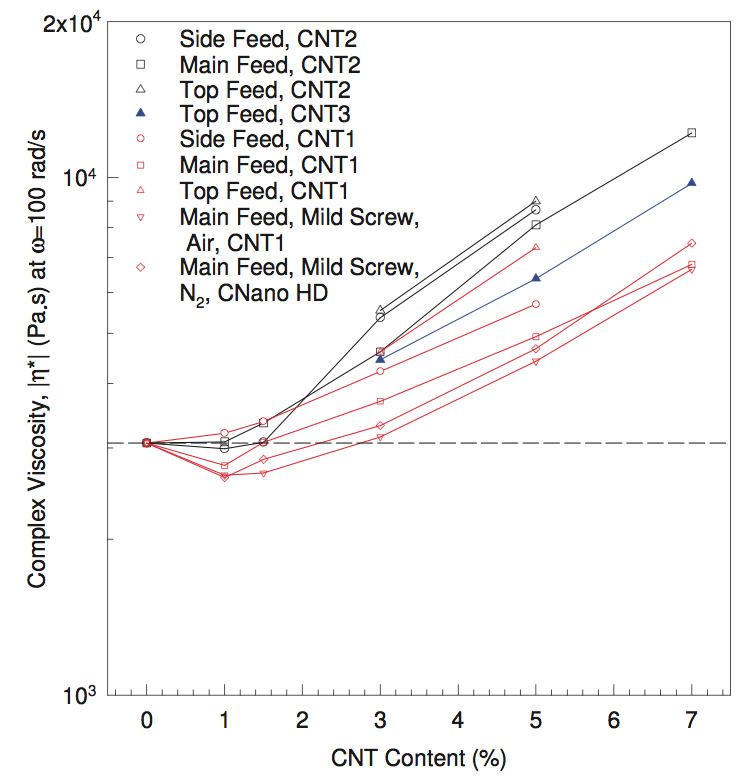
Figure 10. High-Frequency Complex Viscosity of CNT- PC1 Compounds at 235°C
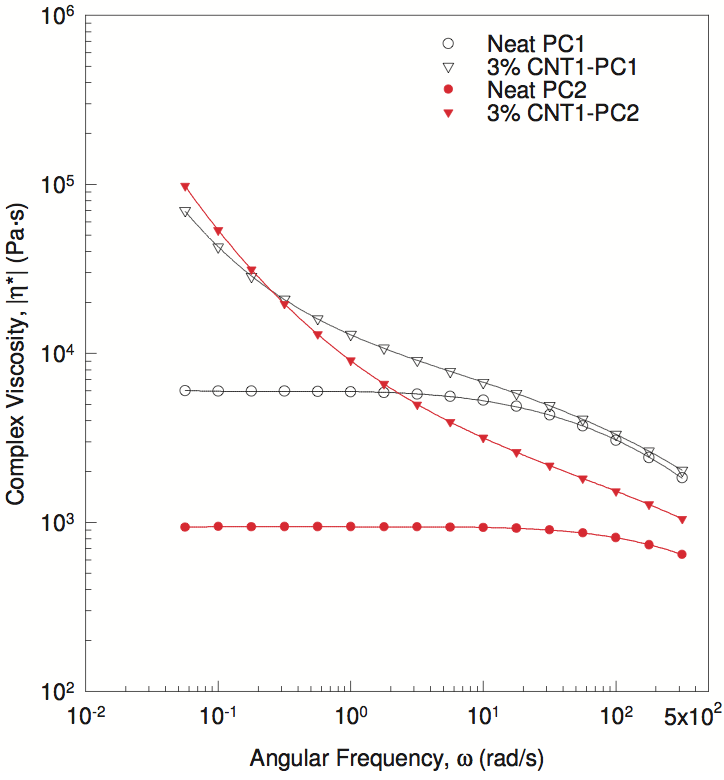
Figure 11. Effect of PC-Type on Complex Viscosity of 3% CNT1-PC Compounds at 235°C, Main Feed, Mild Screw, N2
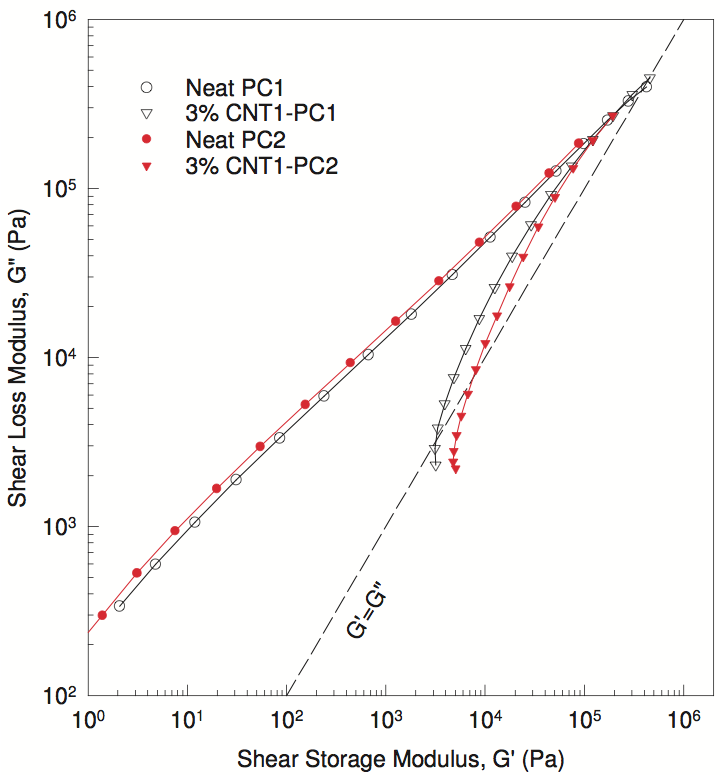
Figure 12. Effect of PC-Type on Cole-Cole Plots of 3% CNT1-PC Compounds at 235°C, Main Feed, Mild Screw, N2
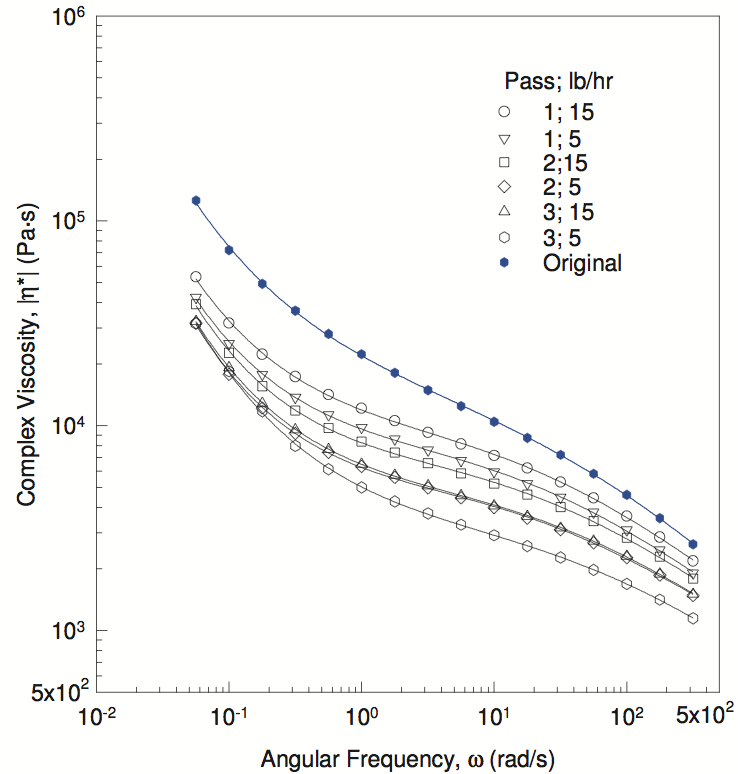
Figure 13. Effect of Residence Time in TSE on Complex Viscosity of 3% CNT1-PC1, Mild Screw, Vac/Air
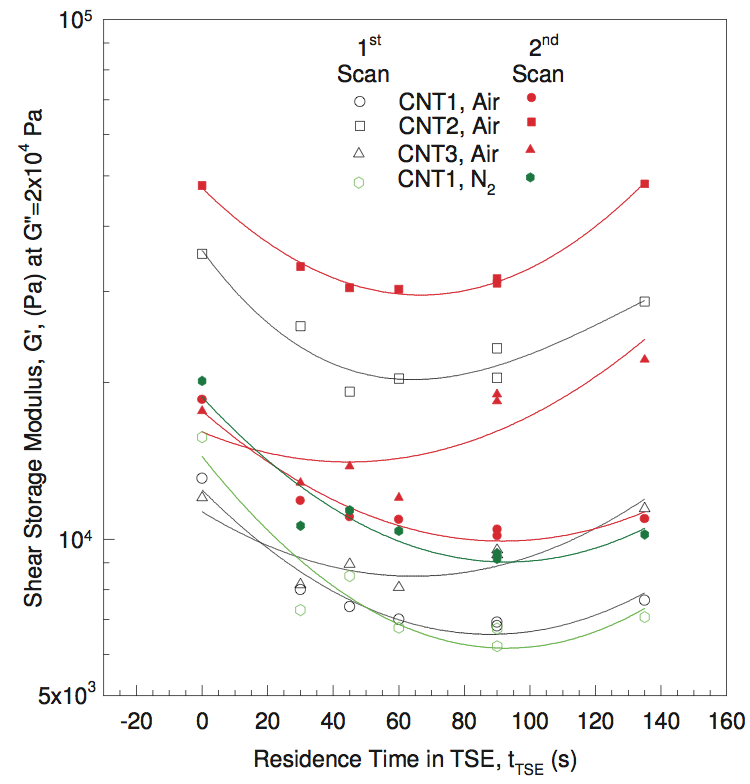
Figure 14. Effect of Residence Time in TSE on the Structural Parameter of 3% CNT-PC1 Measured During the First and Second Frequency-Scans at 235°C
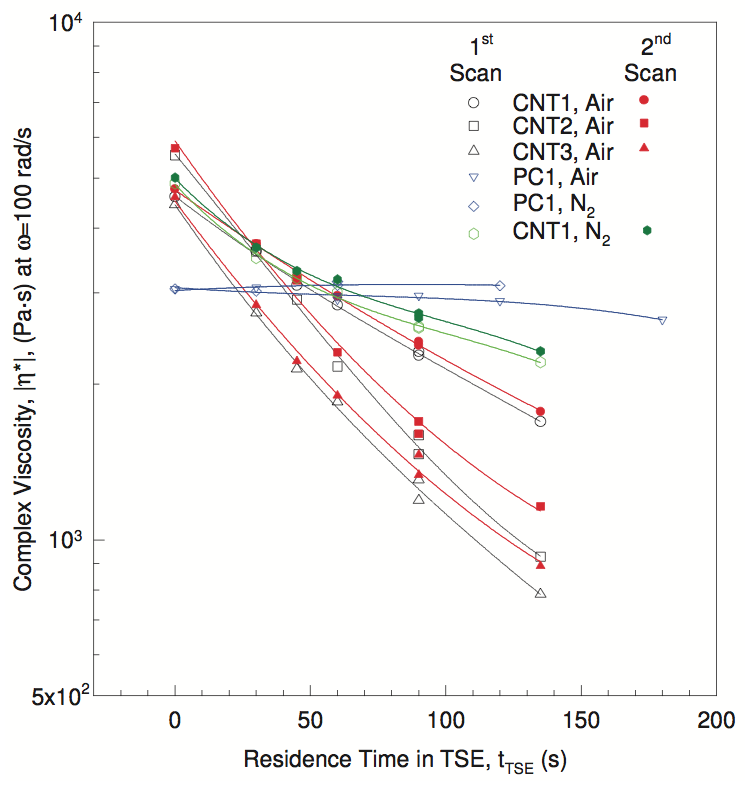
Figure 15. Effect of Residence Time in TSE on Frequency Complex Viscosity of 3% CNT-PC1 the High- Measured During the First and Second Frequency-Scans at 235°C
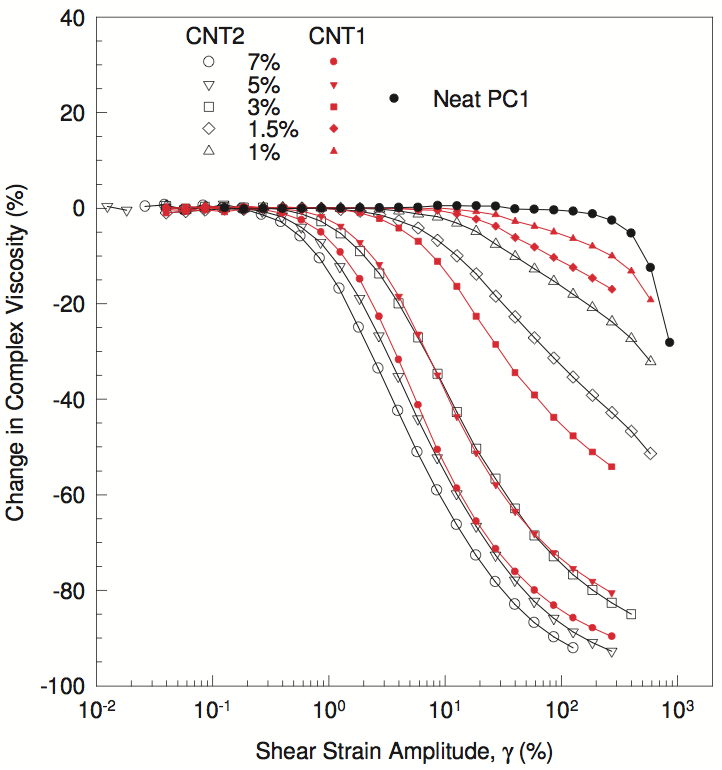
Figure 16. Percent Decrease in Complex Viscosity of CNT-PC1 Compounds as Functions of Shear Strain Amplitude and CNT Content at 235°C and ω=1 rad/s
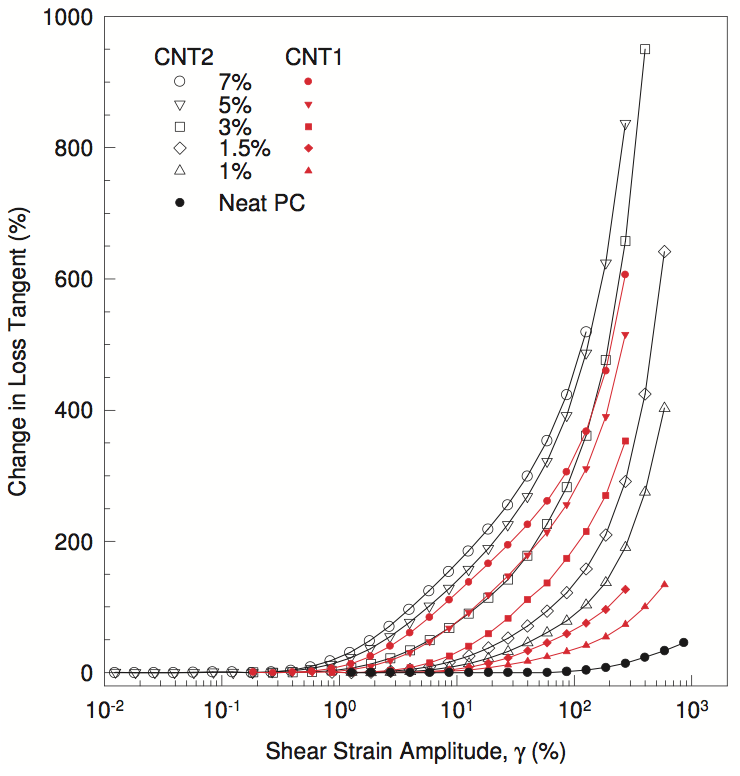
Figure 17. Percent Increase in Loss Tangent of CNT-PC1 Compounds as Functions of Shear Strain Amplitude and CNT Content at 235°C and ω=1 rad/s
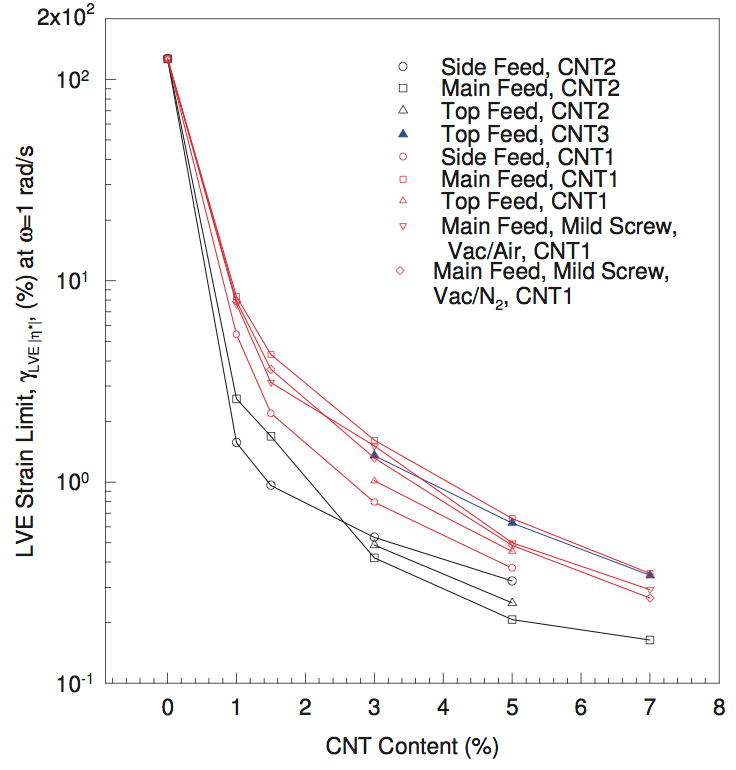
Figure 18. LVE Strain Limit for Complex Viscosity of CNT-PC1 Compounds at 235°C and ω=1 rad/s
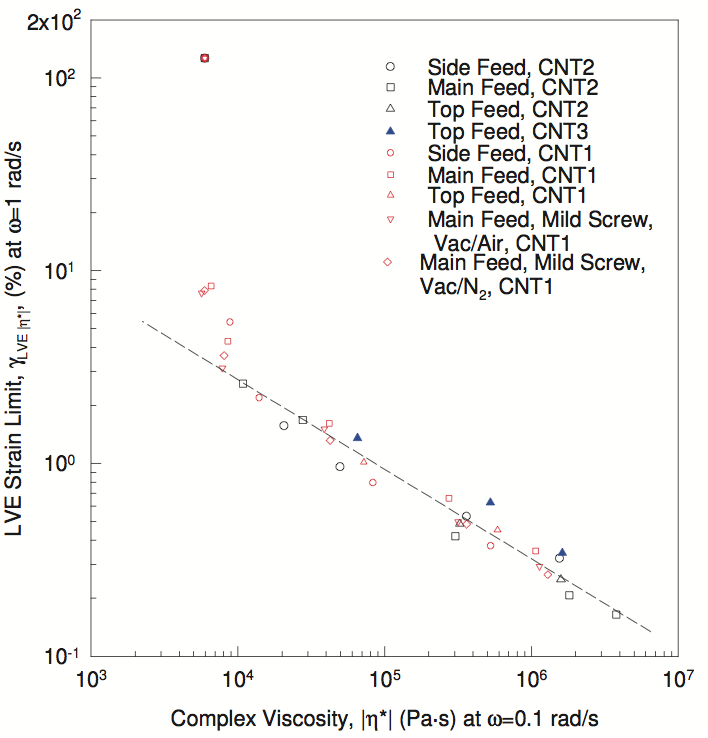
Figure 19. Correlation Between LVE Strain-Limit and Complex Viscosity for CNT-PC1 Compounds at 235°C and ω=1 rad/s
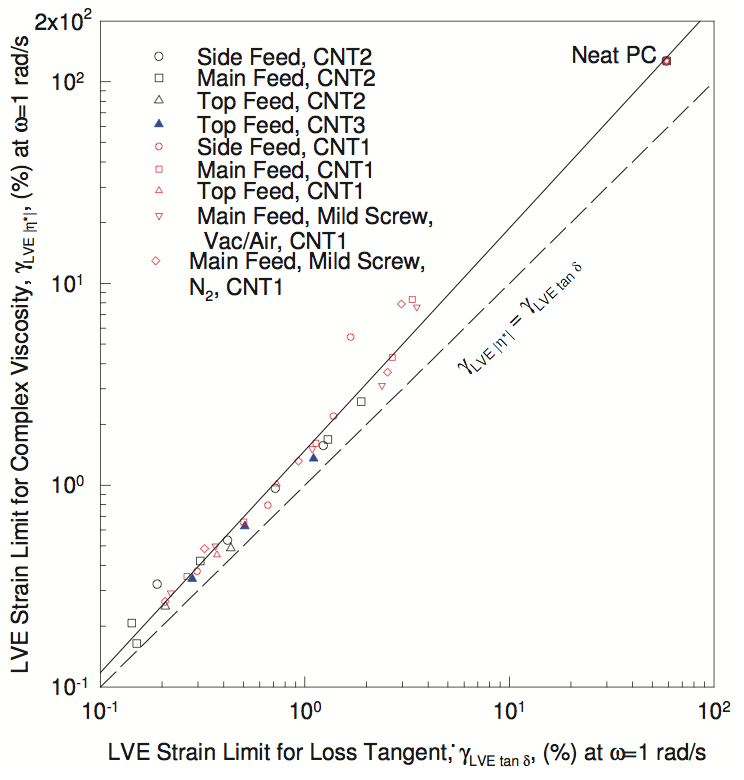
Figure 20. Relationship Between LVE Strain-Limits for Complex Viscosity and Loss Tangent for CNT-PC1 Compounds at 235°C and ω=1 rad/s
Return to
Paper of the Month.