Variables Strength Stress Bead Analysis in a Twin Screw Extruder
William Pappas, Harry Brown II, Graeme Fukuda, Roba Adnew and David Bigio,
University of Maryland, College Park, MDAbstract
An experiment has been created that relates stress
distribution history with residence time distribution. To
quantify the results, stress beads that break up at a specific
stress were used to measure the percent of material that
sees those critical stress values throughout the extruder.
Two different strength stress beads were used along with
two different screw geometries at the mixing section to
complete the experiment. This paper describes results for a
range of different throughputs and speeds in the extruder.
Introduction
Extrusion is a viable technique for creating an
array of different products across a broad spectrum of
disciplines. Examples include pipes and tubes, chemical
pressure-sensitive adhesives, and active ingredient patches
for pharmaceutical industries [1]. One of the more
intriguing applications for extrusion is the production of
composite materials using fillers, such as carbon
nanofibers. This process produces an extruded material
with altered properties than that of the base polymer, such
as heightened thermo-conductive and mechanical strength
properties. There are several factors that determine the
change in properties of an extruded material. One such
factor is the amount of mixing a material within an
extruder experiences. To be able to determine the degree
of mixing, it is important that one accurately models the
stress that is induced for a given screw geometry and
operating condition.
Mixing with a twin-screw extruder is categorized
as either distributive or dispersive. Distributive mixing
uniformly distributes particles throughout the melt and
dispersive mixing breaks large particles and distributes
them throughout the melt. Narrow kneading blocks are
used for distributive mixing as the melt flows in and
around the paddles, producing low shear. Dispersive,
however, is a high shear process as it utilizes wide
kneading blocks. Wide kneading blocks force the material
around the blocks that is squeezed between the paddles and
the barrel wall [2].
There have been numerous attempts in the past to
find a correlation between stress in an extruder and a
residence-time distribution. Efforts have been made to use
the residence distribution to imply intensity of mixing by
various methods, e.g.; Peclet number or a number of passes
[3]. Typical residence distributions, however, only provide
an axial history of the flow and give no information
regarding the stress history. In a recent study, it was shown that for any given operating condition there was a higher
percentage of stress beads that saw the critical stress for
wide kneading blocks compared to narrow kneading
blocks. It was also revealed that the amount of stress
increases as specific throughput and screw speed increased
[8].
The aim for this paper is to explore in greater
depth what accounts for these breakup differentials in wide
and narrow kneading block residence stress distributions
(RSD). Two different batches of stress beads were utilized
to aid in the insight to this question. The two different
critical stresses at which these beads break up in give a
larger range of data, allowing to further pin-point where
the true damage is occurring in the extruder. Operating
conditions were the same for all experiments so the
comparison is strictly due to geometry.
Materials
The extrusion material used for this experiment
was high-density polyethylene (HDPE) Alathon H6018 in
pellet form from Equistar Chemicals. The HDPE had a
density of 0.960 g/cc and a melt index of 18.0 g/10 min.
Stress sensitive sensor beads were utilized as the
method to measure the stress in the extruder. The beads
are used to measure shear stress during mixing by breaking
at specific critical stress levels which are dependent on the
bead diameter. When the beads are subjected to stress
levels beyond the critical shear stress, the beads break and
release their encapsulated dye which stains the polymer
melt. Two levels of stress beads were selected to
determine if the individual bead could distinguish between
the stresses induced by the different mixing elements. The
critical stresses of the two beads used in this experiment
were 92 kPa and 119 kPa.
Using the same dye that is encapsulated by the
stress beads, Red B Disazo for the 119 kPa stress level
beads and Automate Blue 8A for the 92 kPa, “reference”
dye shots were produced. These shots were prepared by
dissolving polystyrene pellets in xylene, and adding
concentrated amounts of dye. The solution was allowed to
solidify over a 24 hour period. The batch was then cut into
small pieces and weighed to the amount of the measured
stress bead shots. The dye shots were used to produce
reference RTD curves that represented 100% breakup of
the stress beads.
Equipment
The experiments were performed using a 28-mm
Coperion CoTSE extruder with an L/D = 32 using two
screw configurations of interest. The melting section of
both screw designs remained unchanged for the duration of
the experiment and consisted of one right-handed kneading
block (28-mm) and one left-handed kneading block (14-
mm). The mixing section of the first screw design
contained two right-handed kneading blocks (15 and 42-
mm) and one left-handed conveying element (28-mm).
The second screw configuration consisted of four righthanded
kneading blocks (15-mm) and one left-handed
conveying element (28-mm). The extruder set up consists
of a feed port and one vent port just before the mixing
section, as seen in Figure 1. The extruded polymer was
cooled via a chill roller where it was then collected as
strips.
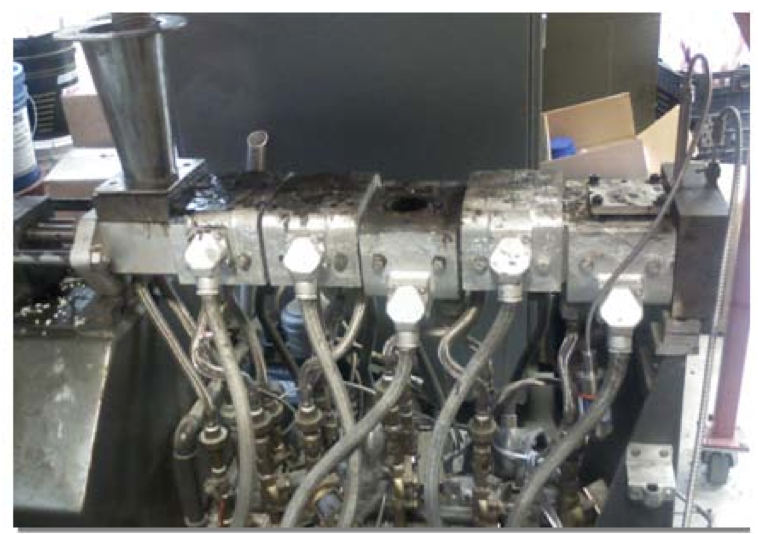
Figure 1. 28-mm Coperion Co-Rotating TSE
A reflective optical probe was placed just before
the die of the extruder. The probe consists of a split fiberoptic
bundle, where light was emitted from one of the fiber
bundles. The light reflected off the polymer and screw
elements, and was collected by the other fiber bundle,
where it was converted into a voltage signal.
Experiment
The extruder and pellet feeder were set to the
desired operating condition. The five barrels were set to a
temperature of 200
oC and the die was set to 195
oC. The
data acquisition program began sampling for 15 seconds to
establish a baseline. Due to the transparent nature of HDPE
during extrusion, TiO
2 pellets were fed at a constant rate
during the experiment to provide a white background to the
polymer melt so the optical probe could make
measurements. Both the stress beads and the solid pieces of
dye were injected into the vent port through a modified
syringe. The tip was removed and covered tightly with a
layer of thin lens paper. Then either the pieces of dye or stress beads were loaded into the syringe so that they lay
on top of the lens paper. Adding a plastic point to the
rubber tip allowed the plunger to pierce the lens paper
releasing the shot. When the TiO
2 white baseline became
constant the syringe would be held over the vent port and
the shot would be injected in a single impulse. This method
proved more precise in minimizing the channels the shot
would disperse in. Since small amounts of the dye shots
were fed into the extruder, the concentration of the dye and
polystyrene had a negligible effect on the viscosity of the
HDPE melt. Once the stained polymer had been
completely extruded, the data acquisition program was
reset and the program was again run for 15 seconds to
establish a baseline. In total, nine operating conditions
were tested, with two dye and two stress bead shots fed per
condition.
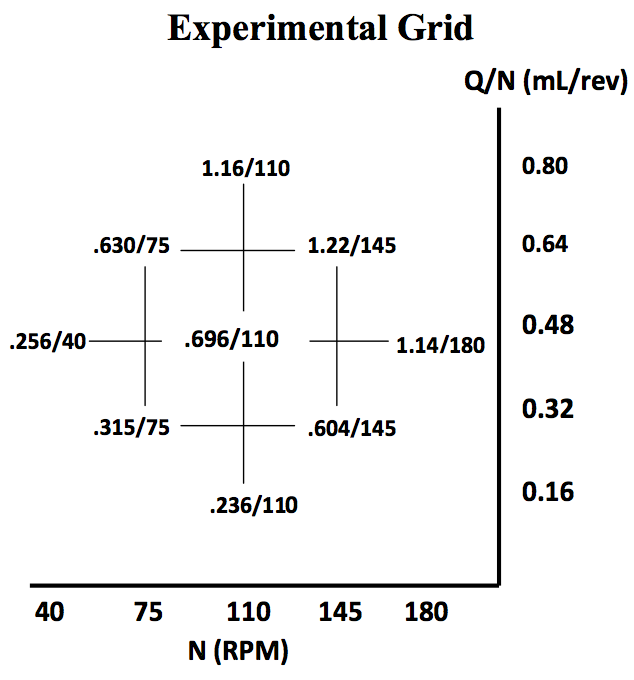
Figure 2. CCD grid of experimental conditions
A central composite design (CCD) of experiment
grid was used to layout the data to show relationships
between percent breakup and different operating
conditions, as seen in Figure 2. This approach was chosen
because of the expected non-linear relationship between
breakup and the chosen parameters. The specific locations
on the grid represent the operating conditions for this
study.
The ranges of the conditions were determined by
the capabilities of the extruder. The first number of a
condition represents the throughput, Q, measured in mL/s.
The second number represents the screw speed, N, in rpm.
N vs. Q/N was chosen because RTDs scale with Q and N.
Theory
To better understand what mechanisms are
responsible for breaking the beads, both shear and
elongation (extensional) stress calculations were
preformed. The shear stress was calculated using the
following equation:

Where τ is shear stress (Pa), μ is viscosity of the polymer
(Pa-s), y is shear rate (1/s), and n is the power law index.
The shear rate is defined as:

where N is screw speed (rpm), D is the screw diameter
(mm), and h is the channel height (mm).
The extensional equation is derived by
considering a flow between two plates. One of the plates is
stationary, and the other is moving towards the plate, as
seen in the following figure below (Figure 3).
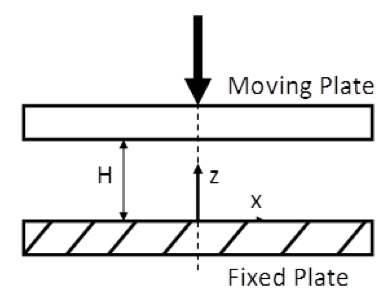
Figure 3. Squeezing plate figure
Starting with the vorticity equation and
substituting in the stream function equation to solve for the
stream function (which is done so in almost every fluid
mechanics text book), the resulting equation is given by:

From Equation (3), the horizontal velocity component (u)
can be obtained by:

The term of interest is the extensional shear rate in the
horizontal direction. To obtain this, Equation (4) is
differentiated with respect to x.

Integrating the z term over the height between the two
plates, and adding scale terms to keep the dimensions of
the equations the same, Equation (6) is derived.

Where V is the velocity of the moving plate (mm/s), H is
the final height between the plates (mm), w is the width of
the kneading block paddle (mm).
The extensional stress (τ
e) can be calculated using
Equation (7).

The results from both calculations are displayed in Table 1.
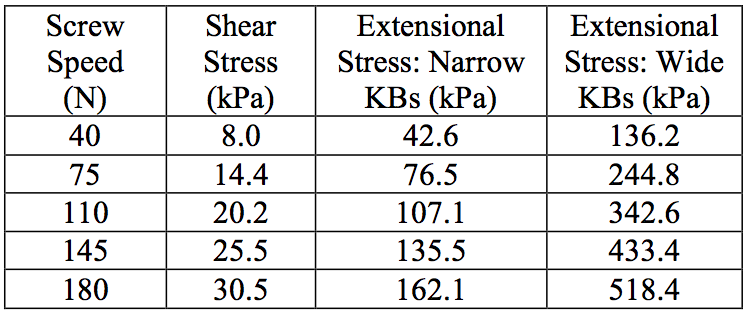
Table 1. Calculated shear and extensional stresses
The extensional stress equation is a good
approximation of the stress since it increases as the width
of the kneading block paddle increases. Breakup in the
kneading blocks could either occur in the flow in the
channel or through the gaps between paddles. This would
induce shear stress. Another possibility could be due to the
squeezing of the fluid when opposing paddles approach
one another. This causes elongational stress. Comparing
the calculations, it is clear that the elongational stress has a
higher magnitude than the shear stress approximations.
This could provide some insight into the mechanisms that
is causing the bead breakup.
Experimental Results
Percent BreakupThe average percent breakup for all nine
experimental conditions was calculated and the results
inserted into the Central Composite Design grid for
analysis as a way to compare the breakup history in the
wide and narrow kneading block configurations. To
determine the percent breakup of stress beads, the areas
under the RTD and RSD curves were calculated and used
in the followed equation:

Where Ac is the area under the RSD curve and Ar is the
area under the dye RTD curve.
The first set of beads used in the experiment was the higher
critical stress beads (119 kPa). Figures 4 and 5 below
displays the percent breakup of stress beads in the CCD
grid using Screw 1 and Screw 2, respectively.
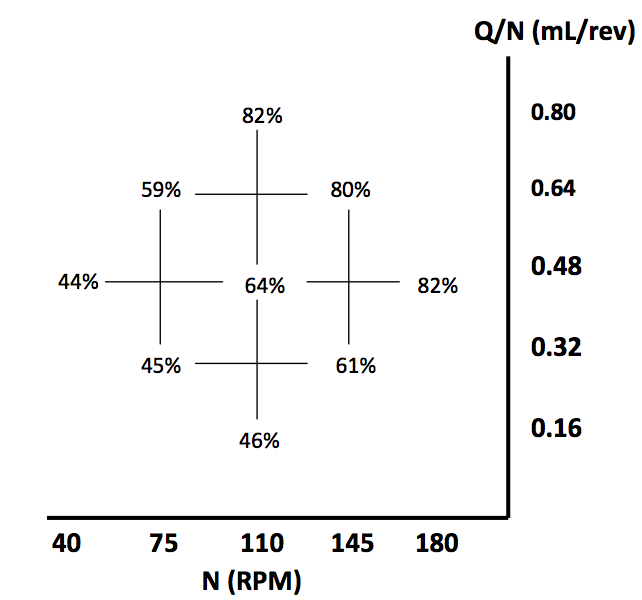
Figure 4. Percent breakup of 119 kPa beads using wide kneading blocks
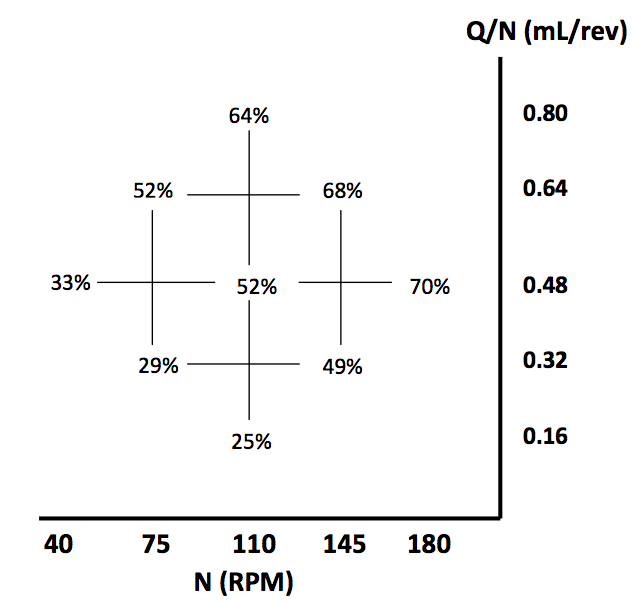
Figure 5. Percent breakup of 119 kPa beads using narrow kneading blocks
The CCD grids displayed in Figures 4 and 5 indicate that
there are trends in the data that are consistent between the
two screw geometries. As screw speed is increased for a
given specific throughput, the percent breakup of the stress
beads also increases. Additionally, as specific throughput
increased, the percentage of broken beads also increased
for a given screw speed.
Given the experimental error, which was
calculated to be 2%, the average range of breakup for both
grids is approximately 35% between the lowest and highest
magnitude of breakup. However, differences between the
grids exist. The magnitude of the percent breakups is
different between the two geometries. The wide kneading
blocks reach a maximum value of 82%, while the narrow
kneading blocks only reach a maximum percent breakup
value of 70%. Similarly, for a given operating condition,
the percent breakup due to the wide kneading blocks is
larger than the narrow kneading blocks, in every case.
Through the trends in the data, screw geometry
and screw speed are not enough to predict the amount of
bead breakup that will occur. A consideration for the
specific throughput also needs to be accounted for when
predicting breakup.
The second set of stress beads (92 kPa) were then
used, and the results of the experiments using wide
kneading blocks were plotted in Figure 6 and the results
using narrow kneading blocks were plotted in Figure 7.
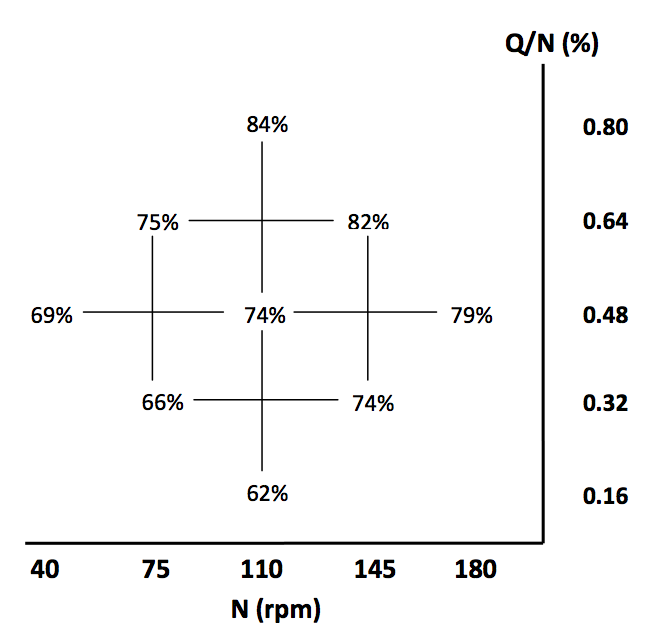
Figure 6. Percent breakup of 92 kPa beads using wide kneading blocks
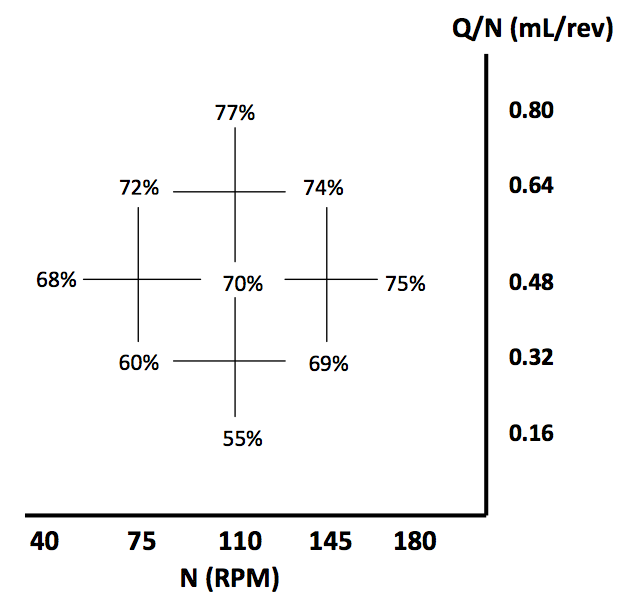
Figure 7. Percent breakup of 92 kPa beads using narrow kneading blocks
Similar to the plots shown in Figure 3 and 4, there
are also consistent trends in the results of the experiments
using the 92 kPa stress beads. It is seen again that by
increasing Q/N and N, a higher percentage of stress beads
that break is produced.
The average range of breakup for this set of
geometries is approximately 15% between the lowest and
highest breakup. The maximum breakup for the wide
kneading blocks was found to be 84% and a maximum
value of 77% for the narrow kneading blocks. Similar to
the other results using the 119 kPa beads, the wide
kneading blocks caused more beads to break for each
operating condition in the experimental grid.
Looking at the two CCD grids for the 119 kPa
beads and the two grids for the 92 kPa stress beads, there
are similar trends between the two. For both sets of beads,
as screw speed and flow rate are increased, the percentage
of broken stress beads increased in every condition.
Additionally, wide kneading blocks caused more breakup
than narrow kneading blocks for each condition for both
levels of stress beads. This again confirms the fact that
wide kneading blocks are ideal for dispersive mixing
because of the larger induced extensional flow.
Comparing the differences between the two sets
of stress beads (Figures 3 and 4 versus Figures 5 and 6), it
is apparent that there was less breakup using the stress
beads that had a critical stress of 119 kPa than the beads
with a critical stress of 92 kPa. This is most noticeable for
the three operating conditions with the lowest flow rates
(.256mL/s - 40 rpm, .315mL/s - 75rpm, and .236mL/s -
110rpm) where the average difference between breakups of
the wide kneading blocks was approximately 20% between
119 kPa and 92 kPa stress beads, and even more apparent
using the narrow kneading blocks where the average
difference between the two stress beads is over 30%.
However, the differences in percent breakup for the three
operating conditions with the highest flow rates (1.16mL/s
– 110rpm, 1.22mL/s – 145rpm, and 1.14mL/s – 180rpm)
are not as large. The average difference for the narrow
kneading blocks is a little more than 5% and there appears
to be no difference for the wide kneading block geometry.
This is due to the limitations of the analytical method,
which can be seen in the residence stress distribution
curves.
Residence Stress DistributionsUsing the RTD and RSD curves generated by the
experiments, a visual representation of the percent breakup
could be generated, as seen in Figure 8.
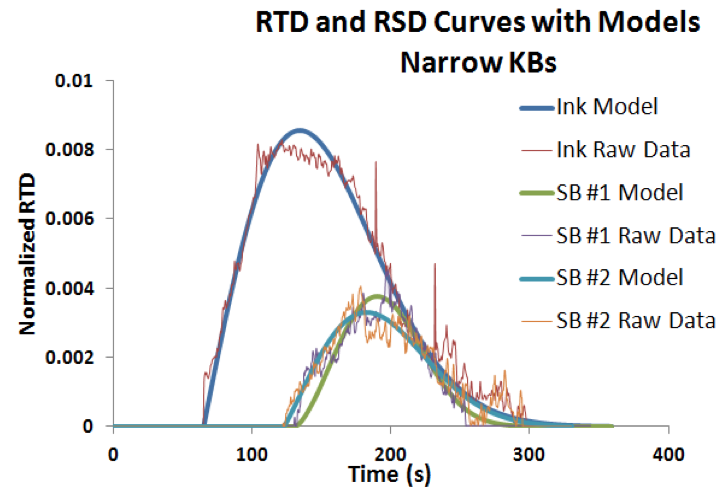
Figure 8. Normalized narrow kneading blocks RTD and RSD curves for .315mL/75rpm condition
The figure above shows the normalized RTD and
RSD curves produced by the ink and 119 kPa stress beads (SB) shots, as well as models generated using a Weibull
model. The percent breakup for this particular operating
condition was 29%. The two sensor bead shots are nearly
identical, indicating that the experiment is repeatable.
Additionally, the amplitude of the ink curve is much larger
than the sensor bead curves, indicating that 100% breakup
was not achieved. It is clear that there is a delay between
the start of the ink curve and the start of the sensor bead
curves. As a percentage of the beads flow through the
center of the channels in between the paddles of the
kneading blocks, the beads experience very little shear
stress. This delay time provides evidence that 100%
breakup of sensor beads will never be achieved, and could
indicate why more than 80% breakup could not be
achieved for the 92 kPa stress breads using wide kneading
blocks.
Conclusions
A previous paper has introduced the use of stress
sensitive beads as an effective tool to measure the stress
history in the complex geometries found in twin-screw
extruders. For this experiment a comparison of wide and
narrow kneading block screw configurations was
performed over a range of specific throughputs (Q/N) and
screw speeds (N) as well as over two different strength
stress beads. For a given operating condition the
percentage of beads broken was higher for wide kneading
blocks when compared to narrows, of equal length, and for
the 92 kPa beads when compared to the 119 kPa beads, of
equal amounts.
These results can be interpreted in two ways.
They first help to reaffirm that for the wide kneading
blocks a higher percentage of stress beads experienced the
critical stress at the same operating conditions, in all cases.
This outcome has been replicated twice for each operating
condition because this pattern holds true for both sets of
beads. Secondly the results help to validate the use of the
stress beads by showing that the beads do not break
arbitrarily, but at certain predetermined critical stress
values.
Through the calculation of shear and extensional
stresses through the kneading blocks, it can be concluded
that extensional stresses play a dominate role as the
mechanism that causes the stress beads to break. This
indicates that the stresses occur in the region between the
two screws when the material on one paddle is forced to
flow to either side of the paddle and is squeezed by the
paddle from the other screw.
These results illustrate the validity of this method
of modeling stress in a twin-screw extruder. Further analysis and experiments can yield even more insights into
the stress history of an extruder. Such that it may be
possible to dictate how much material sees certain levels of
stress by selecting a screw geometry, specific throughput
and screw speed.
References
1. K. Kohlgruber, “Co-Rotating Twin - Screw
Extruders”, Hanser Gardner Publications, Inc., Ohio,
pp 22-275 (2008).
2. H.F. Giles, Jr., J.R.Wagner, Jr., and E.M. Mount, III,
“Extrusion: The Definitive Processing Guide and
Handbook”, William Andrew, Inc., New York, pp.
119-121 (2005).
3. Z. Tadmor and C.G. Gogos, “Principles of Polymer
Processing”, John Wiley & Sons, Inc., New Jersey, pp.
648-650 (2006).
4. J. Curry and A. Kiani, “Measurement of Stress Level
in Continuous Melt Compounders”, SPE-ANTEC
Tech. Papers, 36, 1599-1602 (1990).
5. J. Curry and A. Kiani, “Experimental Identification of
the Distribution of Fluid Stresses in Continuous Melt
Compounders – Part 2”, SPE-ANTEC Tech. Papers,
37, 114-118 (1991).
6. M. Gallant, “Continuously Graded Extruded Polymer
Composites for Energetic Applications”, PhD Thesis,
2003.
7. J. Cheng, Y. Xie, D. Bigio, “Characterization of
Kneading Block Performance in Co-Rotating Twin
Screw Extruders”, SPE-ANTEC Tech. Papers, 198-
202, (1998).
8. D. Bigio, W. Pappas, H. Brown II “Residence Stress
Distributions in a Twin Screw Extruder”, SPE-ANTEC
Tech. Papers, 1382-1386 (2011).
Return to
Paper of the Month.