3D Simulation of the Fluted Mixer Element Behavior
Pavel Kubik, Department of Polymer Engineering, Faculty of Technology, Tomas Bata University in Zlín, Zlín, Czech Republic.
Jiri Vlcek and Jiri Svabik, Compuplast International, Inc., Zlín, Czech Republic
Martin Zatloukal, Polymer Centre, Faculty of Technology, Tomas Bata University in Zlín, Zlín, Czech RepublicAbstract
One of the most important, yet problematic, issues in
the extrusion process is achieving good mixing.
Considerable prior efforts have been made to understand
different types of mixing elements for single-screw and
twin-screw extrusion. However, there is still a lack of
good process values or criteria that can be used for design
purposes. The focus of this work is to better quantify the
mixing behavior, using 3D FEM analysis, to develop
some design criteria. This study will focus on the fluted
mixer, comparing common design variations and the
effect of material viscosity and process conditions.
Introduction
Mixing elements can be viewed as unknown and
mysterious parts of plastics industry. Therefore, it is not
surprising that considerable effort is done to study
different types of mixing elements in single-screw [1-3]
and twin-screw [4-11] extrusion. Even if many useful
conclusions can be extracted from the open literature, full
understanding of mixing elements behavior is still not
available.
Another aspect, very important in study of mixing
elements, is practical knowledge of experienced workers
but reality can be different.
In this paper, a deep attention is focused on a fluted
mixing element widely used in the plastics industry. Two
slightly different designs are studied. One type is much
easier to manufacture and many people believe that this
geometry change has very little impact on its
performance.
For this purpose, a full 3D Finite Element Method
simulation will be utilized to understand the effect of the
fluted mixer element in extrusion process.
Methods
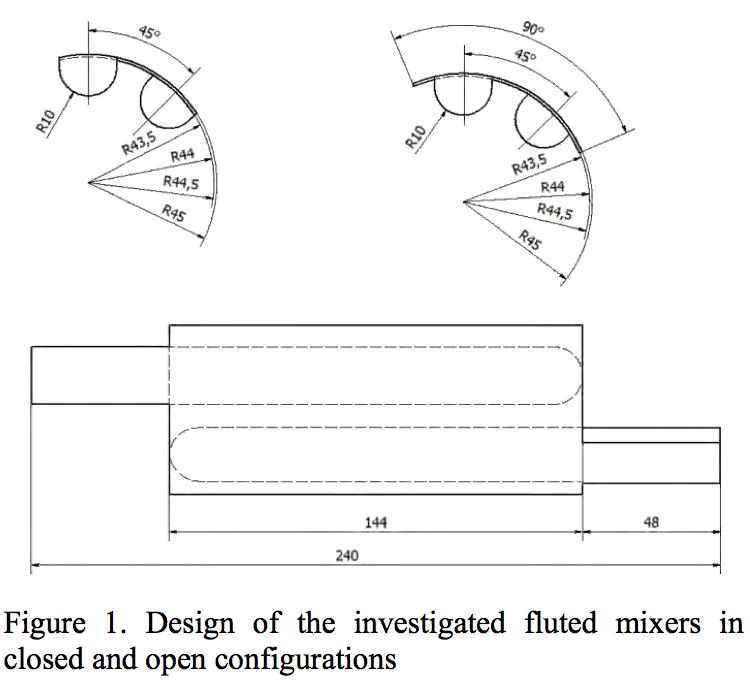
Two types of fluted mixing elements can be seen in
Figure 1. The first one, so called a closed mixer, had an
undercut on one flight between the channels. The second
flight of this mixer does not have an undercut. This flight
wipes the surface of the barrel. In this case, the material
entered the gap over the undercut only through the inlet
channel. The second one, so called an open mixer, had
undercuts from both sides of the channels and there was
no wiping of the material from the barrel surface. Because
of this, the melt did not enter the channel only from the
inlet, but also from the side.
A basic 3D FEM grid was generated by a fluted
mixer template, which is a special part of the VEL
TM
software [12]. Now, the grid was refined especially in the
corners and along the length to minimize the
computational errors and to increase the numerical
stability. The diameter of the mixer analyzed was 90mm and three different undercut gaps, 0.5 - 1.0 - 1.5 mm, were
used for the numerical analysis. Both fluted mixers were
tested under the same process conditions specified in
Table 1.

Materials
The main material used for the study was low
viscosity LDPE, which was completely predefined in the
VEL
TM software material database. The material
description is based on the Carreau-Yasuda model, in
which the viscosity dependence is decribed by the
following equation:

Where A is the zero shear viscosity, a, n, r are the
constants, the T is temperature and γ is the shear rate.
The material temperature dependence f(T) is exponential
and is given by the following equation:

The parameter b represents the temperature
sensitivity and T
r is the reference temperature. The
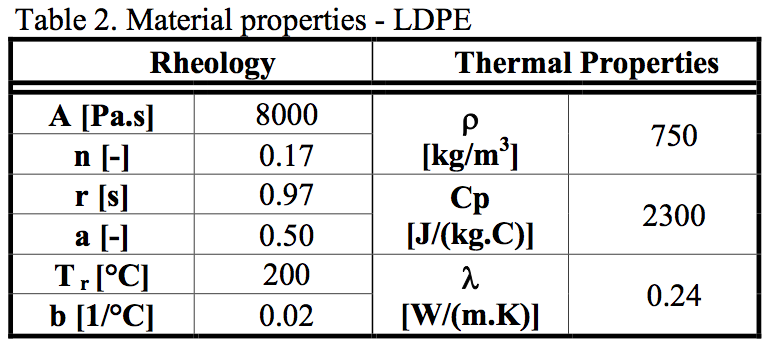
equation parameters and the material properties are
summarized in Table 2.
The material had a very low shear viscosity (its MFI
is about 4). It was chosen to eliminate the dissipation
during the flow through the element and thus to see the
effect of mixing.
The second material used for comparison at the
1.0mm gap was a high viscosity HDPE. Its viscosity is
described by the Power-law model. The viscosity equation
is:

Where A is the zero shear viscosity, γ is the shear
rate, n is the Power-law constant. The temperature
dependence f(T) is the same as for the LDPE material (eq.
2). Values of the Power-law parameters and melt
properties can be seen in Table 3.
This material was much more viscous (its MFI is
about .3). When such a material flows through the mixing
element there was a coupling of two effects. The first one
was mixing as in the previous case and the second one
was the dissipation.
Modeling
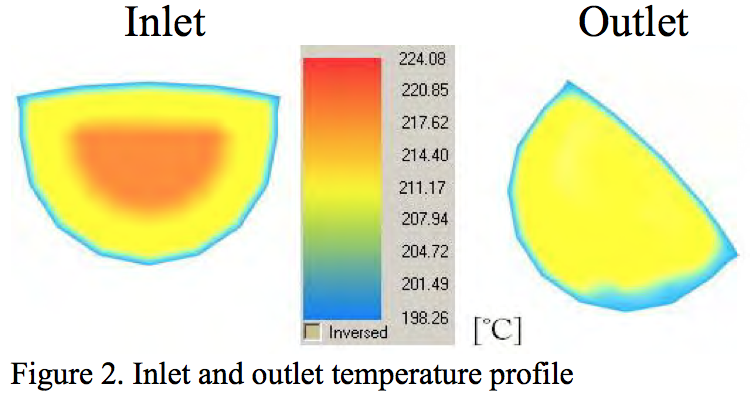
The inlet temperature was set as a temperature field
in the range of 220°C to 200°C. The temperature contours
are shown in Figure 2. As can be seen, the hottest melt
was in the center of the inlet channel and the walls were
set as the coolest place with constant temperature 200 °C.
The aim of this was to see the changes in the temperature
field. This can helped understand the behavior of the
fluted mixing element. There were two expected effects.
One was the cooling/heating of the material while going
through the mixing element. The second one was the
homogenization of the temperature field. The temperature
homogenization was given partially by the conductivity
but mainly by mixing. Such a mixing corresponded to a
pure blending and it was based on particle displacement
only. It was not say anything about breaking particles
inside the element etc. If it was found that the mixer
homogenized temperature well it means that it would also
mix compatible materials with similar viscosities.
The temperature change in the average temperature
showed how much the material generated heat and how
much heat was conducted through the wall, mainly the
barrel.
For the LDPE material with its low viscosity we
could expect that the dissipation will be low and thus the
temperature changes were given mainly by the heat
transfer. For the HDPE material we have a combination of
both effects.
Results
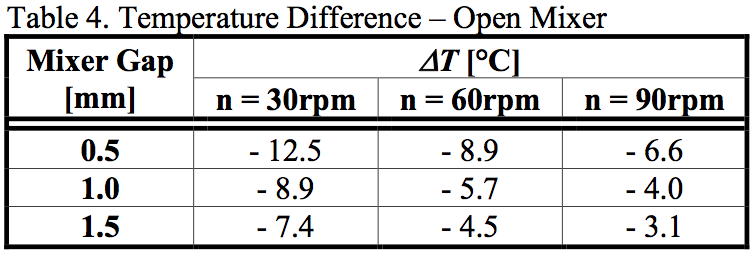
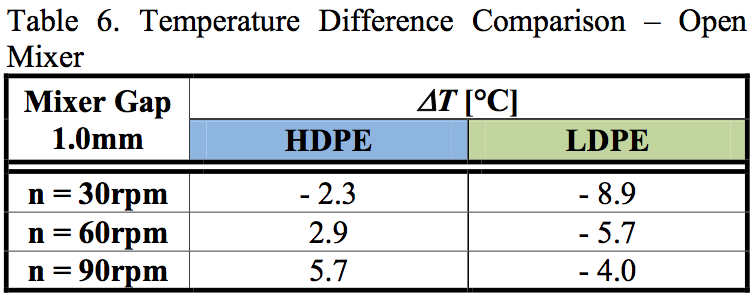
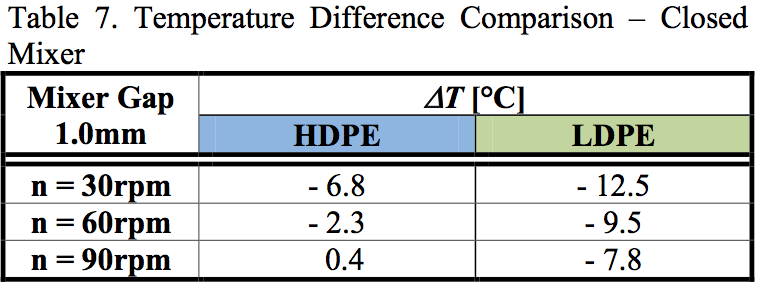
The difference in the average inlet and outlet
temperatures, ΔT, as a function of the screw rotation and
the fluted mixer gap are given in Tables 4-7. Tables 4-5
contain the results for the LDPE material, while Tables 6-
7 provide the results for a comparison with the HDPE
material for the undercut gap 1.0mm. As can be seen from
the calculated data summarized in Tables 4-7, the value
ΔT differs significantly between the open and closed
fluted mixers even if the corresponding processing
conditions are identical.

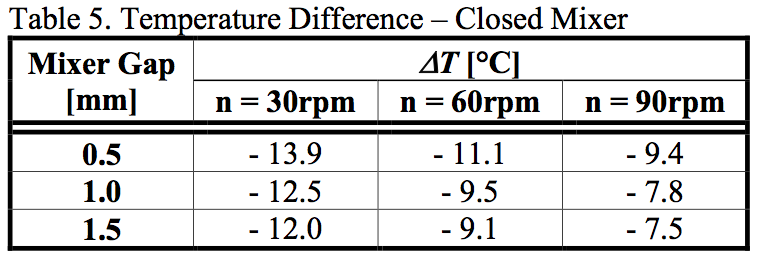
The highest temperature drops of LDPE occurred for
the lowest screw rotations because the melt had the
longest residence time allowing a more effective heat flux
through the walls.
A comparison of temperature changes for both
materials indicated that temperature decreased for all
screw rotations for LDPE, while for HDPE the sign of the
temperature change depended on screw rotations.
Temperature decreased for slow rotations and increased
for the highest one. This means that the dissipation was
higher than the cooling. A comparison of values for LDPE
and HDPE also showed that HDPE temperature drop is
much higher than for LDPE. This was because of the
dissipation in the HDPE material. If we subtracted the
temperature difference for the LDPE material from the
value for the HDPE one this gave the temperature rise
because of the dissipation. It can be seen that the
difference is in all cases about 7 °C.
Interestingly, the open fluted mixer had always lower
temperature drops ΔT than the closed one. This can be
explained by a presence of a layer, which was rotating
very close to the barrel and it was not wiped by the flight.
The polymer melt has a low thermal conductivity and the
layer functioned as an insulation layer. Thus, the layer
restricted heat flux through the walls. A flow path of a
particle from the insulation (not wiped) layer is shown in
Figure 3.
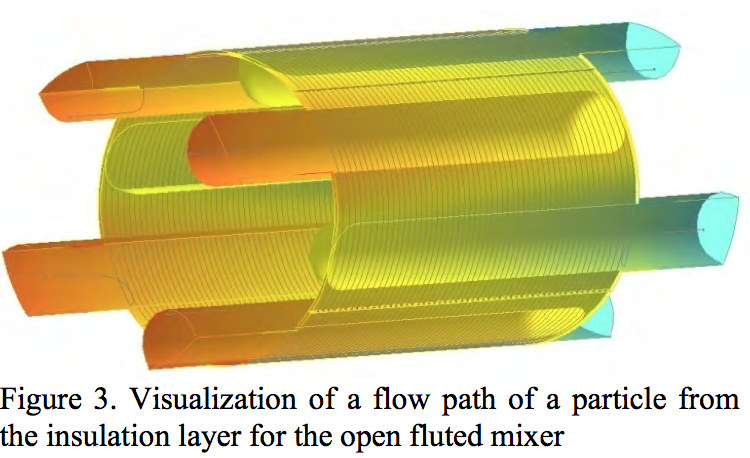
Figure 3. Visualization of a flow path of a particle from
the insulation layer for the open fluted mixer
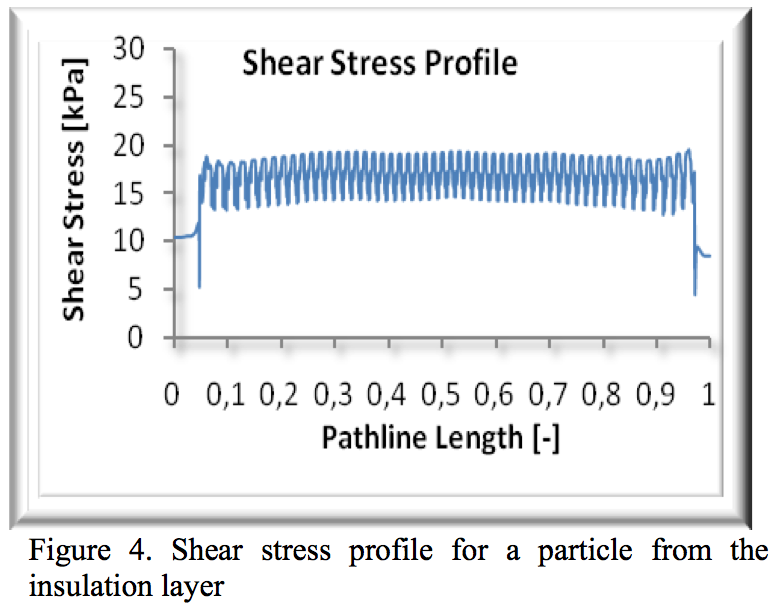
It should be also mentioned that the residence time of
the particles in the insulation layer was six times longer
than residence time of other particles and the shear stress
in this layer was found to be less than 20 kPa. A low shear
stress may lead to polymer melt degradation [13]. The
shear stress profile along the flow path of the particle in
the insulation layer is shown in Figure 4.
A comparison of the behavior of a mixing element
with and without the wiping flight showed that there was
a difference in the mixing element behavior and that the
mixing element without the wiping flight had a lower
cooling efficiency and much higher residence time, which
means it could easier initiate the material degradation.
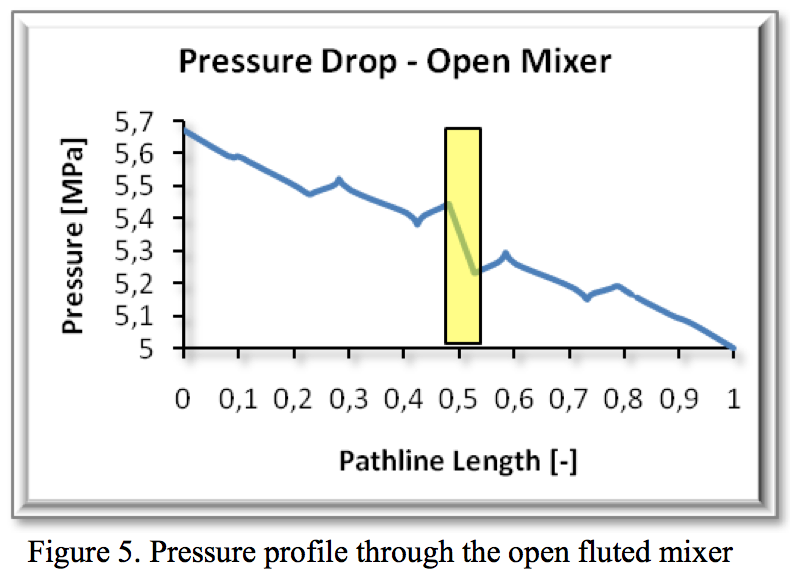
The second studied effect was the pressure drop on
the mixing element. All pressure values were counted
from the same path line, which was going through the
center of the gap and mixing element. The pressure drop
and the barrier pressure drop on the open mixer are shown
in Table 8 and Table 9. As can be seen, the pressure drop
of the most closed gap was almost three times bigger than
on the open gap. The path line position was chosen in a
way that the shear stress was not dominant and therefore
the influence of the drag flow was the controlling factor.
The pressure drop went down with the increase of screw
rotations and also with opening the gap. The barrier
pressure drop shown in Figure 5 in a highlighted rectangle
shows what part of the overall pressure drop was
consumed during the flow over the undercut. There were
local maxima when the material was comes close to the
barrel and minima when the material was at the bottom of
the channel. The highest drop was over the barrier.


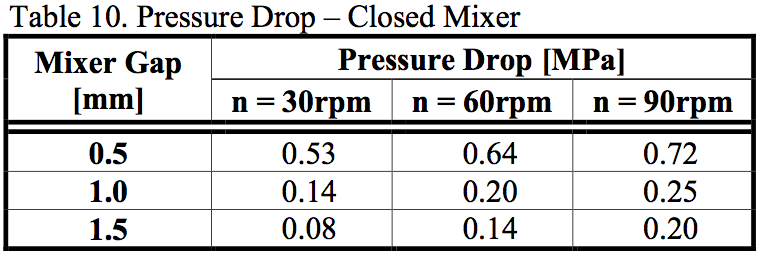
The pressure drop on the closed mixer is shown in
Tables 10 and 11. It can be seen that the situation was
completely different from results for the open mixer. The
barrier pressure drop became sometime negative.
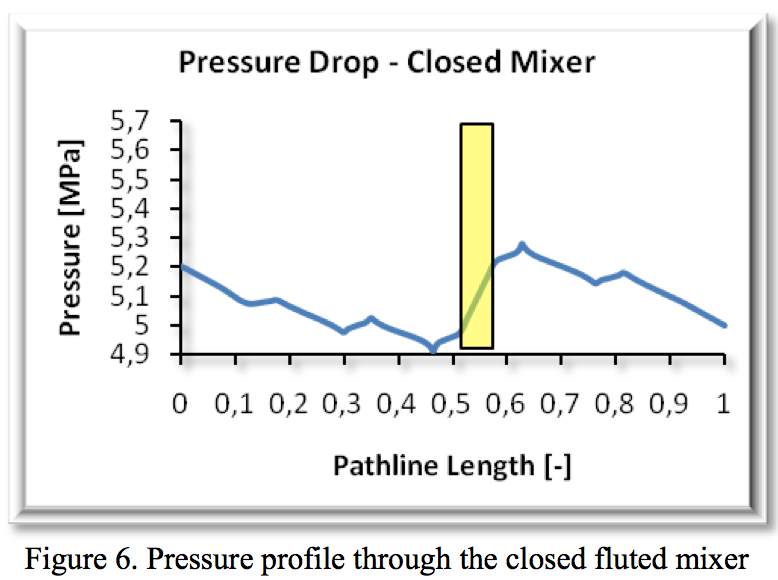
Therefore, pressure was generated while the material
flowed through the gap on the closed mixer. It is
demonstrated in figure 6. As displayed in Figure 6,
pressure decreased again until the undercut area, which is
represented by a yellow rectangle, where the pressure
rose. The local minima and maxima were again close to
the screw or the barrel surface. The pressure drop also
increased more for higher screw rotation and the gap size.
Pressure was consumed for the smallest gap.

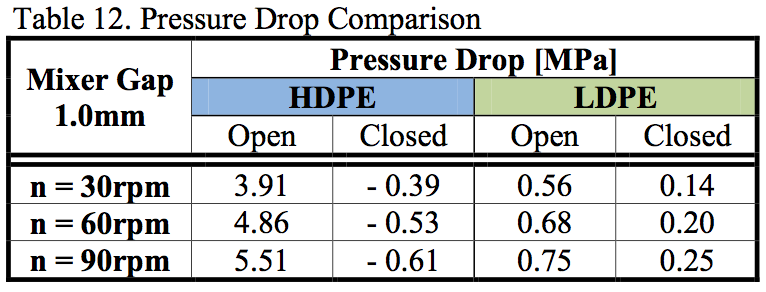
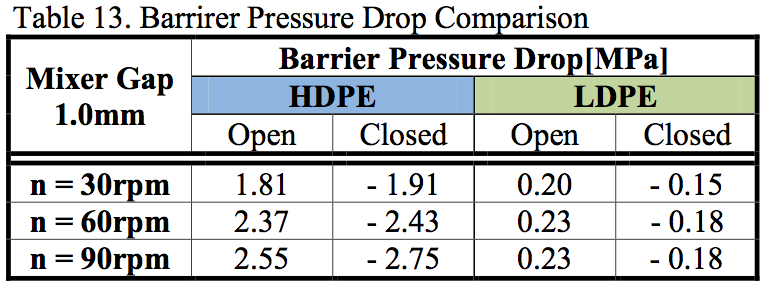
A comparison of the pressure drops for a 1 mm gap
on both types of mixers is shown in Tables 12 and 13. It
can be seen that the pressure drop on the closed mixer was
always higher than on the open mixer. As has been
demonstrated by previous tables for LDPE, the open and
closed mixers behave differently. The pressure behavior
of the more viscous HDPE in the open and closed
configuration was similar to LDPE. Pressure drop and
barrier pressure drop profiles had a similar trend like for
LDPE but the values were higher because of the material
viscosity.
In the final stage of the research, the mixing
efficiency of the closed and open fluted mixers was
investigated by a λ parameter, which is defined as:

Where D is the deformation rate tensor and ω is the
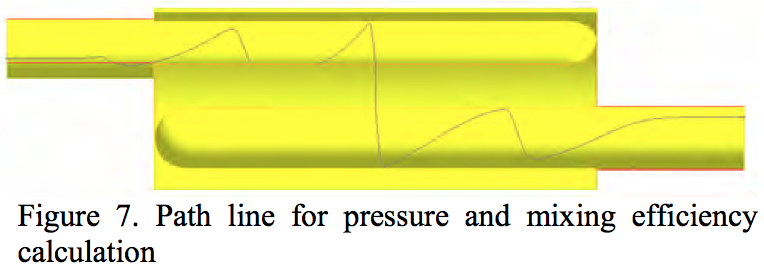
vorticity tensor. The mixing coefficient λ was calculated
along the same path line as the pressure and is depicted in
Figure 7.
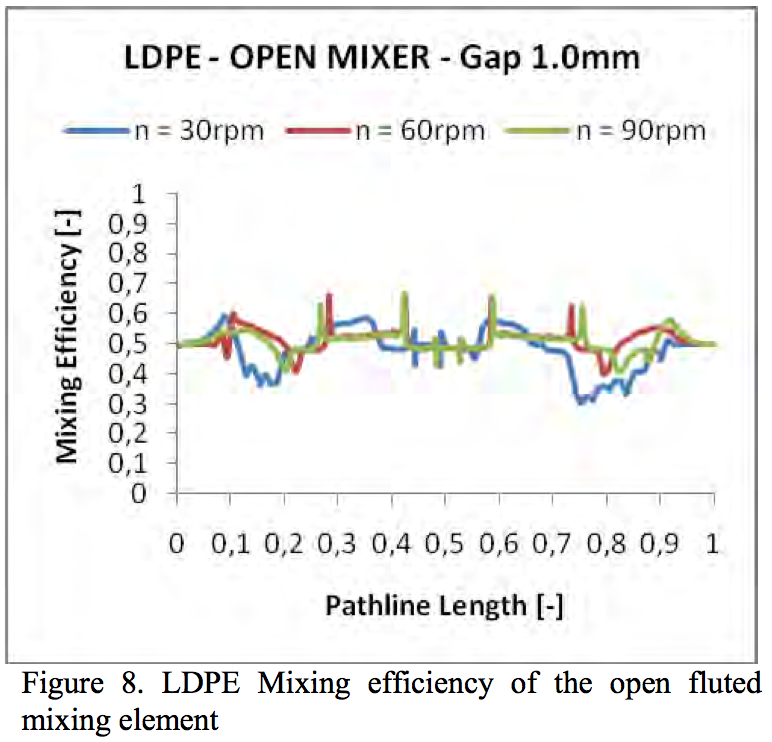
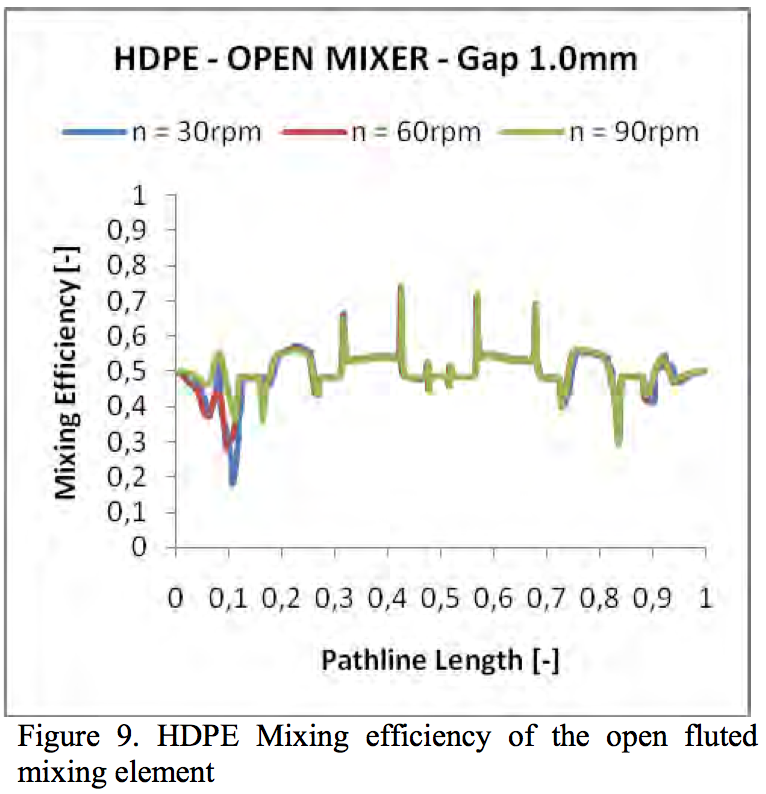
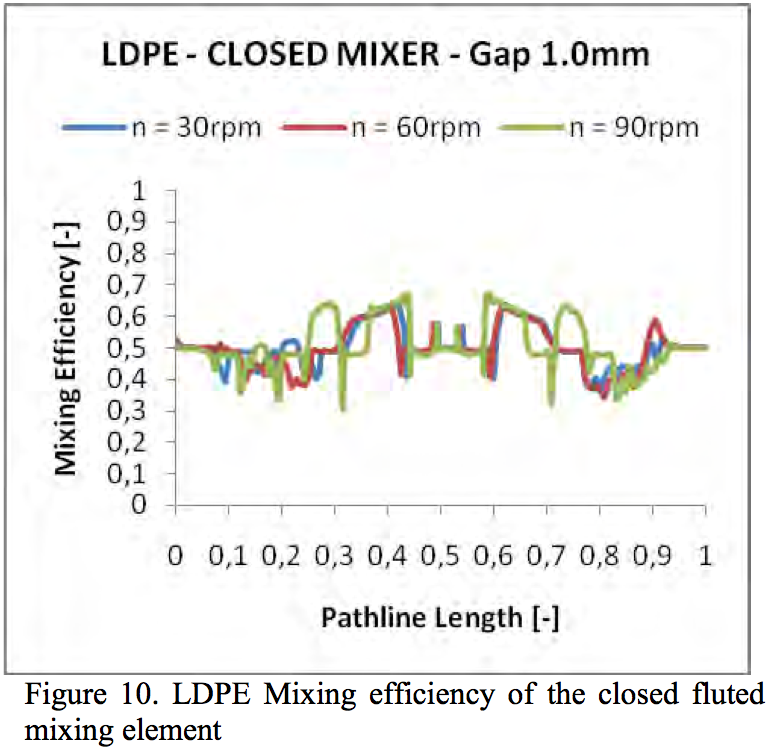
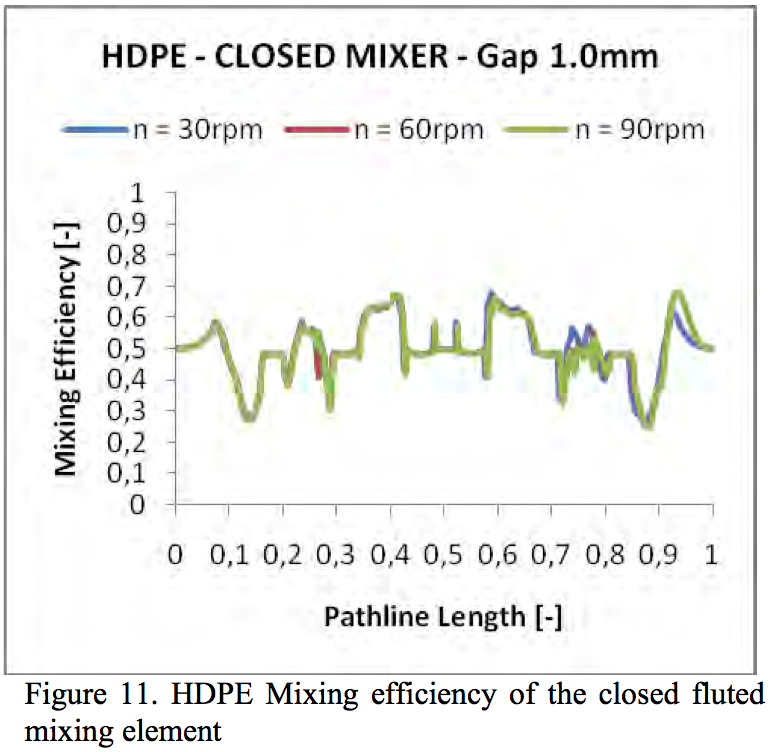
Figures 8 - 11 show the calculated mixing efficiency
parameter λ for 1.0mm gap on the open and closed fluted
mixer elements. Interestingly, the mixing efficiency is
almost the same in all cases. Thus, the geometry changes and material properties did not have any impact to mixing
efficiency parameter.
It can be seen that the parameter λ was in most cases
around a value.5, which means the shearing. This
confirmed that the majority on both cases of the mixers
was the shear mixing.
Resume
The simulations performed show different behavior
of the open and closed fluted mixers. The main reason of
this difference is the existence of insulation layer for the
open mixer. This layer is located at the barrel surface and
it works as a barrier of the heat transfer. On the other side,
since the layer is there it occupies certain part of the gap
over the undercuts and thus it makes the gap effectively
smaller than for the closed mixer. This layer is wiped out
in the closed mixer. It has been found that the shear stress
in the insulation layer is lower than 20 kPa, which may
lead to polymer melt degradation. Pressure profiles and
pressure drops depend also on the material type, gap size
and the speed of rotation. The analysis clearly shows that
the mixing efficiency defined by the λ parameter is
independent on the material properties and the geometry
variations of the fluted mixer.
References
1. A. L. Kelly, E. C. Brown and P. D. Coates, Polymer
Engineering and Science 46, 1706-1714 (2006).
2. M. E. Ghir, C. G. Gogos, D. W. YU, D. B. Todd and
B. David, Advances in Polymer Technology 17, 1-17
(1998).
3. D. Strutt, C. Tzoganakis and T. A. Duever, Polymer
Engineering and Science 40, 992-1003 (2000).
4. G. Shearer and C. Tzoganakis, Advances in Polymer
Technology 20, 169–190 (2001).
5. D. Strutt, C. Tzoganakis and T. A. Duever, Advances
in Polymer Technology 19, 22–33 (2000).
6. M. A. Huneault, M. F. Champagne and A. Luciani,
Polymer Engineering and Science 36, 1694-1706
(1996).
7. V. L. Bravo and A. N. Hrymak, Polymer Engineering
and Science, 40, 525-541 (2000).
8. V. L. Bravo, A. N. Hrymak and J. D. Wright, Polymer
Engineering and Science 44, 779-793 (2004).
9. R. Valette, T. Coupez, C. David and B. Vergnes,
International Polymer Processing 24, 141-147 (2009).
10. T. Ishikawa, et al., International Polymer Processing
21, 354-360 (2006).
11. Ch. Rauwendall, Polymer Extrusion, Munich: Carl
Hanser Verlag, 1990.
12. http://www.compuplastvel.com
13. M. Zatloukal, J. Vlcek, A. Slanik, A. Lengalova and J.
Simonik, Applied Rheology 12, 126-132 (2002).
Key Words: Fluted Mixer, Insulation Layer, 3D Finite Element Method Simulation
Return to
Paper of the Month.