An Expanded Residence Stress Distribution Study in a Twin-Screw Extruder: The Effect of Stress Bead Strength
Graeme Fukuda, Roba Adnew, Harry Brown II, Jesse Kim, and David I. Bigio Mechanical Engineering,
University of Maryland, College Park, MDAbstract
The ability to measure Residence Stress
Distribution (RSD) in real time provides a greater
understanding of the extrusion process. A method has been
developed to characterize stress history within a 28-mm
co-rotating twin-screw extruder (CoTSE) through the use
of stress beads that break at critical stresses. Three
different strength stress beads were used to provide an
expanded and robust methodology. A Design of
Experiment (DOE) approach was used to present the bead
breakup results.
Introduction
Extrusion has been a widely researched technique
used for mixing in many different fields. Studies have been
conducted in the pharmaceutical, food, and rubber
industries along with many others [1]. In addition, food
packaging has been an increased area of interest due to
improved properties for barriers protecting food from
oxygen, carbon dioxide, and water vapor [2]. Furthermore,
the advancement of processing polymer composites with
carbon based microfibers and nanotubes has gained
traction. Addition of these fillers can enhance mechanical,
thermal, and electrical properties [3].
Mixing is a critical component to the
characterization of extruded material. Screw configuration
is one such element that alters mixing within an extruder.
Many extrusion processes utilize a mixing section which
contains blades, paddles, or pins [1]. The two mixing
sections studied for this research were narrow and wide
kneading blocks (KB). Narrow KB induce low magnitudes
of shear stress but generate high strain this allows for better
distributive mixing. On the other hand, wide KB focus on
creating high magnitudes of shear stress, which is best
suited for dispersive mixing. Distributive mixing helps
create a uniform spread of particles within the extruded
final product. While dispersive mixing allows for the
capability of breaking agglomerates into smaller particles
[4].
The degree of mixing achieved in a twin-screw
extruder is one of the most important factors that affect the
properties of the final product [5]. Erwin demonstrated that
the use of a mixing section reorients the interfaces of the
fluid for greater area growth and thus better mixing [6]. In
order to successfully determine the degree of mixing that
occurs within the extrusion process, accurate modeling of the induced stress for a given mixing section and operating
condition is necessary.
Past studies have developed RSD measurement
techniques but nothing in real time. Wetzel et al used a
method of a single ultrasonic probe and a tracer to identify
the time the material spends in the extruder, which can
determine the RSD [7]. Curry et al used glass spheres to
measure the stress history. However, the method was
discontinuous because it required burning the polymer off
and manually counting the number of broken glass spheres
[8].
Recent studies using stress sensitive polymer
beads have been used to measure the stress history in real
time [9]. These studies were expanded upon to include
multiple stress beads that varied in strength in order to
observe the accuracy of the methodology. The study
produced similar results to research done with one strength
stress bead thus validating the method of experimentation
[10].
To further expand the analysis of the stress bead
approach this study was conducted using three different
strength stress beads. The DOE approach depicted the
percentage of stress bead breakup along a range of screw
speed (N) and specific throughput (Q/N). The DOE
technique also enabled a statistical analysis to determine
significant processing parameters and generate predictive
equations for percent breakup. The following paper
presents the results of the three stress beads.
Materials
High-density polyethylene (HDPE) Alathon
H6018 in pellet form from Equistar Chemicals was the
base polymer for this experiment. HDPE has a density of
0.960 g/cc and a melt index of 18.0 g/10 min. The stress
beads used were CAlibrated MicroEncapsulated Sensor
(CAMES) beads provided by Mach 1 INC. in King of
Prussia, PA. The CAMES beads measured the stress
during extrusion by breaking at specific critical stress
levels and releasing their encapsulated ink into the polymer
melt. The critical stress level of the beads depends on the
diameter and wall thickness of the bead. The three critical
stresses of the beads used were 92 kPa, 119 kPa, and 158
kPa. The 92 kPa and 158 kPa beads were blue and the 119
kPa beads were red.
For the blue stress beads the same dye that is
encapsulated in them, Automate Blue 8A, was used to stain
the polymer melt as a reference shot. For the red beads, the
dye used was Red B Disazo. The reference shots were
prepared by dissolving super high impact polystyrene
(HIPS) 935E pellets in a heated solvent. The reference dye
shots represented the paths taken if 100% of the stress
beads were broken. This 100% breakup can also be
visualized as Residence Time Distribution (RTD) because
it accounts for all the paths taken by all the different fluid
elements.
Equipment
The experiment was performed on a Coperion
ZDSK-28-co-rotating, fully intermeshing twin-screw
extruder. The screw diameter was 28-mm and the length
to diameter ratio (L/D) was 32. Also, it should be noted
that the extruder is a three-lobe machine. The extruder set
up has a feed port and one vent port before the mixing
section where the stress beads and the reference ink shots
were dropped.
Two different screw geometries were
investigated. Following a melting and conveying region
that were the same, the first mixing section was comprised
of four forward conveying right-handed narrow kneading
blocks 6.0 cm of total length, followed by a reverse
conveying element of 3.0 cm. This geometry ensured that
the mixing section would be filled for all operating
conditions. For the second screw geometry, three of the
narrow kneading blocks were removed and replaced with
one right-handed wide KB of 4.5 cm long. The reverse
element was kept as the backup element for both
configurations.
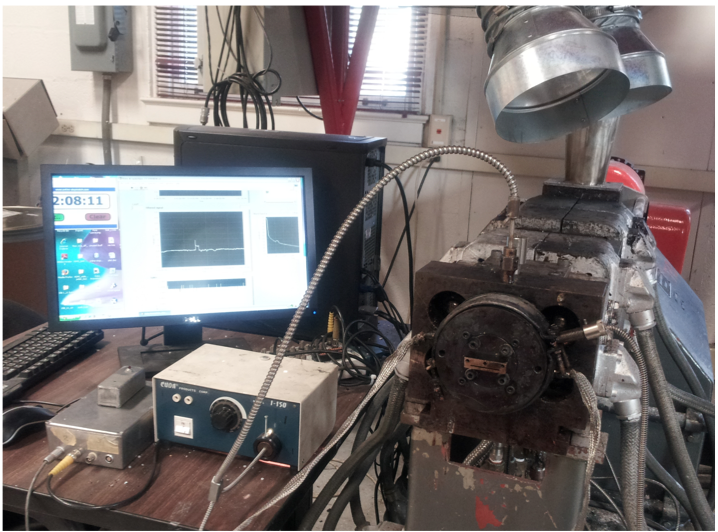
Figure 1. 28-mm Coperion Co-Rotating TSE and data acquisition setup
A reflective optical probe was placed above the end of
the mixing section where the screws are filled. The probe
consisted of a bifurcated optical fiber bundle enclosed in a
stainless steel shell contained in a larger stainless steel shell with a sapphire window. The probe was inserted into
a barrel through a standard Dynisco pressure transducer
port. The probe uses a split fiber optic bundle, where white
light is transferred from one bundle and enters the
extrusion melt. The light is then scattered by the stained
melt and enters back through the other fiber bundle. The
light recorded is converted to a voltage signal using a
photo diode and a signal amplifier.
Experiment
For this experiment, operating conditions were
chosen in accordance to machine specifications, in order to
obtain a wide range of data. The five barrels of the extruder
were set at 200°C and the die zone was set at 195°C for all
experimental runs. Operating conditions were varied by
specific throughput and screw speed.
Data was collected through the optical probe, and
due to the transparent nature of HDPE melt, TiO
2 was
mixed into HDPE to provide a white background so the
optical probe could take proper measurements. Since such
small amounts of dye were mixed with the HDPE melt the
concentration of the dye and polystyrene had a negligible
effect on the viscosity of the HDPE melt. Impulses of
stress beads and reference shots were injected in the melt
once a baseline was established in the data acquisition
program. Once the stained melt was completely extruded,
and the baseline had returned to its original position the
data acquisition program was reset for the next
experimental run. In total, nine operating conditions were
tested for each screw configuration, with an average of two
reference shots and two stress bead shots per condition.
Figure 2 below is an example of the RTD and RSD curves
after analysis. The blue curve represents the reference shot
and the magenta and green curves depict the stress bead
shots.
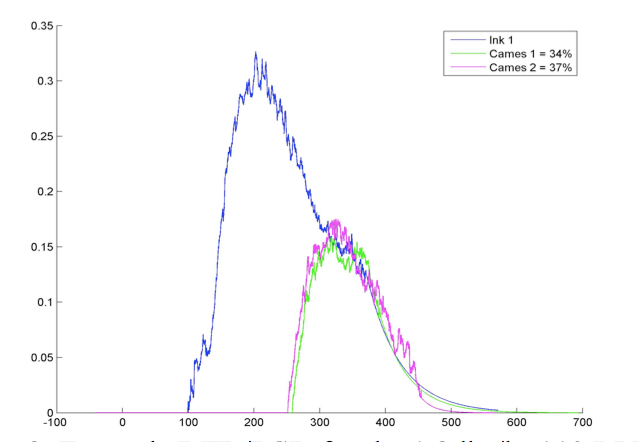
Figure 2. Example RTD/RSD for the 1.8 lbs/hr 110 RPM experimental condition
Experimental Grid
The central composite design (CCD) grid was
chosen for its statistical advantages and visual
representation of the data. Additionally, the CCD grid
clearly displays the relationship between percent breakup
and operating conditions. The vertical axis represents the Q/N in units of mL/rev. The horizontal axis represents N
which is in units of RPM. The values on the grid in Figure
3 represent the mass flow rates in lbs/hr for all nine
experimental conditions. The axes were chosen because
RTDs scale with N and Q/N.
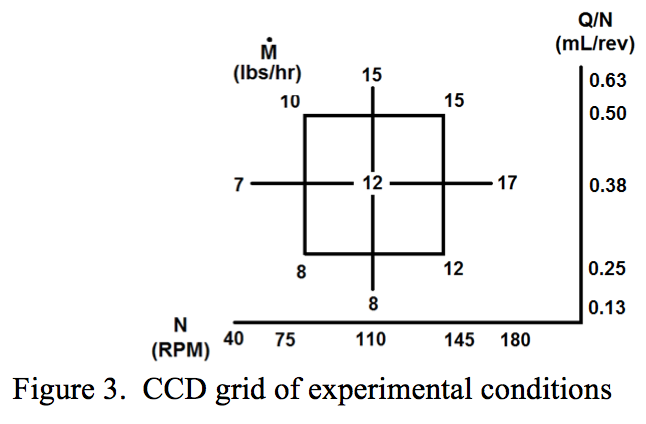
Figure 3. CCD grid of experimental conditions
Experimental Results
Percent Breakup
The average percent breakup for all nine
experimental conditions was calculated and the results
inserted into the CCD grid as a way to compare and
analyze the breakup trends for different bead strengths and
screw geometries to operating conditions. To determine
the percent breakup of the stress beads, the areas under the
RTD and RSD curves were calculated and used in the
following equation:
{eq1}
Where Ac is the area under the stress bead, or RSD, curve
and Ar is the area under the dye, or RTD, curve.
Three different strength stress beads were studied
for this research, 92 kPa, 119 kPa, and 158 kPa. Figures 4
through 9 present the percent breakup results for each bead
from lowest strength to highest using the CCD grid
display.
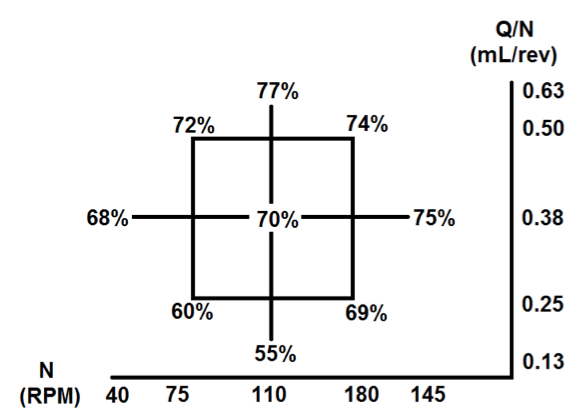
Figure 4. Percent breakup of 92 kPa beads using narrow kneading block

Figure 5. Percent breakup of 92 kPa beads using wide kneading block
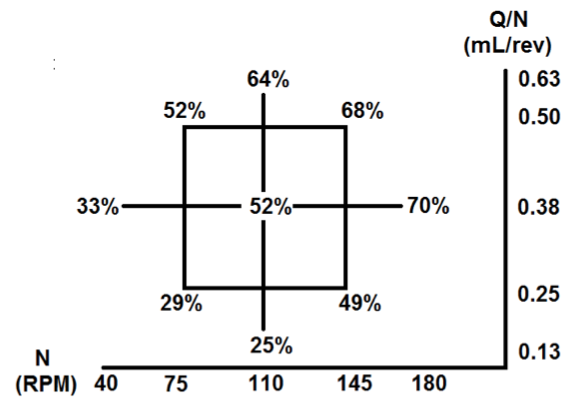
Figure 6. Percent breakup of 119 kPa beads using narrow kneading block
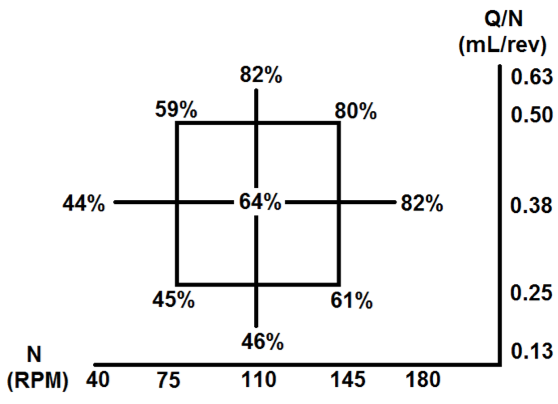
Figure 7. Percent breakup of 119 kPa beads using wide kneading block
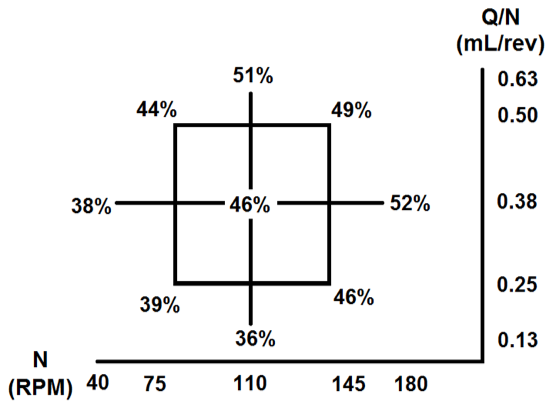
Figure 8. Percent breakup of 158 kPa beads using narrow kneading block
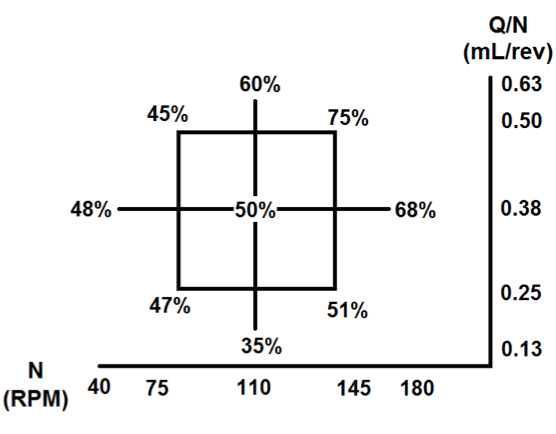
Figure 9. Percent breakup of 158 kPa beads using wide kneading block
For all different strength stress beads certain
patterns reappeared within the CCD grids. The wide KB
geometry for every operating condition had a higher
percent breakup than the narrow KB configuration.
Additionally, the average breakup between grids decreased
linearly with the strength of the stress bead, thus the lowest
breakup results were seen with the strongest bead, the 158
kPa bead. Also the diagonals from the upper right to the
lower left direction for all the grids, which approximately
have the same mass flow, showed similar percent
breakups. The diagonals from the lower left to the upper
right direction showed an increase in breakup, displaying
the significance of N and Q/N.
Each CCD grid was entered into JMP ® 9.0.0
statistical software for additional quantitative analysis. The
results of the statistical report were organized in Table 1.
The most notable result the statistical report indicated was
which operating parameters proved significant on a 95%
confidence interval. In all strength beads only two
parameters were found to be significant, N and Q/N. The
magnitude of the coefficients of N and Q/N are presented
in Table 1. The last third of Table 1 provides statistical
output for the concatenated wide and narrow geometry
grids, which contributed a factor of change between the
overall average and a specified screw configuration.
Equation 2 provides the general form of the
predictive equation obtained. The predictive equation
shows that percent breakup is only a function of screw
speed and specific throughput. Coefficient A specifies the
influence of screw speed on the breakup and coefficient B
specifies the influence of specific throughput on the
breakup. The constant C represents the average breakup for
a specific grid or the intercept. The coefficients are also
displayed in Table 1.

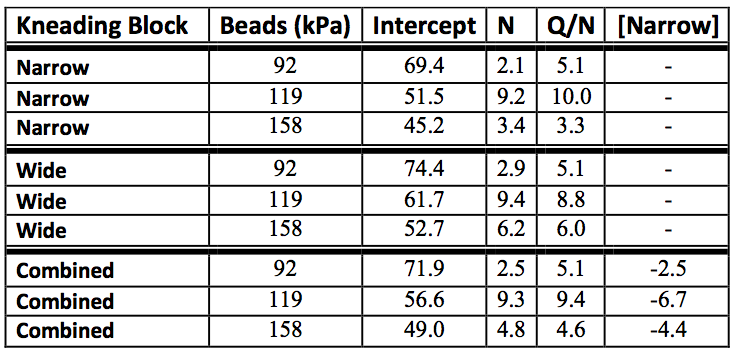
Table 1. Percent Breakup Predictive Equation Coefficients
The kneading block rows labeled “Combined”
represents the average values of the narrow and wide KB
equations. The “[Narrow]” column represents the percent
shift required to bring the average breakup down to the
breakup of the narrow KB grid. The negative sign indicates
that the narrow KB breakups were all less than the average
percent breakup.
Closer inspection of the comparison between
grids brought about additional observations. When
comparing the 92 and 119 kPa strength beads against each
other there is a clear decrease in breakup from the 92 kPa
to the 119 kPa beads. This result concludes that more of
the fluid experiences the lower critical stress level of 92
kPa. For the narrow KB configuration the percent breakup
increased by 10% when changing from the 119 kPa beads
to the 92 kPa beads. Similarly, for the wide KB
configuration the increase was 6%. An explanation for this,
is that for the wide KB there was already a higher percent
breakup, thus less of a chance for increase. Change in
configuration between the 158 and the 92 kPa beads
showed a similar difference. For the narrow KB there was
a difference of 12% and for wide KB a change of 10%.
Again the narrow KB showed more sensitivity to the
change in bead strength. However, between the 158 and
119 kPa beads the difference for the wide KB was 5%, but
the narrow KB only a 2% variation.
Examination of Table 1 yields a deeper
understanding into the causes of breakup and the stress
bead approach. The magnitude of the coefficients in Table
1 represent the sensitivity of the predictive equation to the
changes in input parameters (N, Q/N). The coefficients of
92 kPa beads, compared to the other two beads, has the
largest difference in magnitude between the N and Q/N
coefficients for each screw geometry, with Q/N always
playing a much greater role in percent breakup. The 119
kPa beads have the coefficients with the greatest
magnitude, with values of approximately 9 and 10 for both
N and Q/N for the wide and narrow KB configurations,
which are about double those for the other two stress
beads. This spike in magnitude for the 119 kPa beads
shows that they are the most sensitive with respect to operating conditions. The last observation from Table 1
comes from the 158 kPa bead data. Although the 92 kPa
beads have the largest difference between N and Q/N for
each respective screw configuration, the coefficients for
both N and Q/N for the 158 kPa beads nearly double when
moving from the narrow KB results to the wide KB results.
The other two bead strengths have approximately the same
magnitude for both types of mixing sections. This indicates
that the strongest bead, the 158 kPa, were most sensitive to
the geometry change.
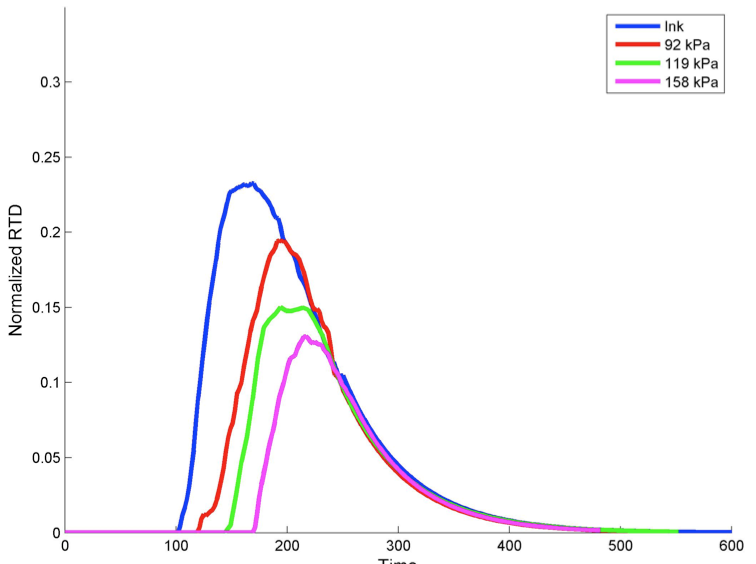
Figure 6. RSD curves 2.4/75 for all three strength beads under a single RTD
Figure 6 above displays the visual representation
of the variation in bead strength with respect to stress
distribution. The selected operating condition was 2.4
lbs/hr and 75 RPM because the curves in this range are
mainly noise free. There are three RSD curves depicted,
one for each stress bead studied. The RSD curve with the
highest magnitude is the 92 kPa bead due to its low critical
stress level. The 119 and 158 kPa beads follow in that
order. This agrees with the quantitative results seen in the
CCD grids. The delay times of all three RSD curves also
exhibits an interesting trend. As the bead strength increases
the delay time becomes longer. This phenomenon is
attributed to more beads passing through unbroken. It has
been shown that the material that comes through the
fastest, travels through the center of the channel where the
stresses are the lowest [11]. The lower critical breaking
stress occurs closer to the center of the channel and will
have a shorter delay time. The higher critical breaking
stress will be experienced closer to the wall resulting in a
longer delay time.
Conclusions
A real time measuring technique for RSD has
been developed in an extruder, using a method involving
stress beads and an optical probe to measure their breakup.
Three separate strength stress beads were used to expand the findings of previous studies and to continue to validate
the methodology. Through a DOE approach, data was
analyzed by evaluating percent breakup as a function of
operating conditions. Screw speed, N, and specific
throughput, Q/N, were found to be significant in breaking
of the stress beads for all conditions tested. Two different
mixing sections of equal length were investigated in this
study. One with only narrow KB and the other with only
wide KB elements, both backed by a reverse element. All
three beads showed to be more susceptible to breaking
under the wide KB configuration. Furthermore, breakup
results showed that the average breakup varied linearly
with the strength of the bead, meaning as the bead strength
went up the overall breakup went down for every operating
condition. The compiled RSD curves also displayed other
patterns with respect to bead strength. As the critical stress
level of the bead increases the delay time also lengthens,
and the magnitude of breakup decreases with increasing
bead strength.
Results from the CCD grids and the table of
coefficients provided additional information to characterize
the stress history. The lowest strength bead, the 92 kPa,
showed the greatest difference between magnitudes of
coefficients for each respective geometry proving they
were affected by specific throughput more than the other
two beads relatively. The strongest critical stress bead, the
158 kPa, had an almost doubling of coefficient magnitude
when moving from the narrow to wide KB geometry,
making the 158 kPa bead the most vulnerable to a screw
configuration change. However, the most interesting of all
the results were with the 119 kPa coefficients. The
coefficients for the 119 kPa beads was far greater than the
both the other two beads. The high magnitudes indicate the
119 kPa beads are the most sensitive to operating
conditions, and thus provide the greatest controllability for
manufacturers. It is postulated that the average stress in the
channel and the critical stress of the 119 kPa are closely
matched. As one changes conditions one strongly changes
the amount of fluid that experience the critical stress. The
ability to categorize stress history in real time enables
manufacturers to better understand how flow path truly
affects their machine and ultimately their product. Future
work will continue to broaden the range of beads studied
along with a greater variation of screw geometry, material,
and operating conditions.
Acknowledgements
I would like to acknowledge all the
undergraduates that aided in running the experiments for
this paper. Beyond the co-authors help from Betel Sime,
Bunty Bhatia, Alexander Moses, and Hoyoung Khang was
invaluable. Additionally, the help of Jason Nixon and Joe
Martin on the MATLAB analysis code provided great
assistance. Also, Mark Wetzel for his counsel and help in
the direction of the experiment.
References
1. K. Kohlgruber, “Co-Rotating Twin-Screw Extruders,”
Hanser Gardner Publications Inc., Ohio, 22-275
(2008).
2. Kluter, R. Kline, L. et al. A Systems Analysis of Meal,
Ready-to-Eat (MRE) Packaging Materials, Report to
Strategic Environment Research and Development
Program, 2-4 (2002).
3. Y. Li, “Effect of addition of carbon nanofibers and
carbon nanotubes on properties of thermoplastic
biopolymers,” Polymer, vol. 52, 2310-2318 (2011).
4. P. J. Cullen, Food Mixing: Principles and
Applications. John Wiley and Sons, (2009).
5. G. C. Papanicolaou, A. F. Koutsomitopoulou, and A.
Sfakianakis, “Effect of thermal fatigue on the
mechanical properties of epoxy matrix composites
reinforced with olive pits powder,” Journal of Applied
Polymer Science, vol. 124, 67-76 (2012).
6. L. Erwin, “New fundamental considerations on mixing
in laminar flow,” SPE-ANTEC Tech. Papers, vol. 24,
488 (1978).
7. M. Wetzel, C. Shih, and U. Sundararaj,
“Determination of Residence Time Distribution
During Twin Screw Extrusion of Model Fluids,” SPEANTEC
Tech. Papers, No. 827 (1997).
8. J. Curry and A. Kiani, “Measurement of Stress Level
in Continuous Melt Compounders,” SPE-ANTEC
Tech. Papers, vol. 36, 1599-1602 (1990).
9. D. Bigio, W. Pappas, H. Brown II, B. Debebe and W.
Dunham, “Residence stress distributions in a twin
screw extruder”, SPE ANTEC Tech. Papers, 1382-
1386, (2011).
10. D. Bigio, W. Pappas, H. Brown II, G. Fukuda, and R.
Adnew, “Variable strength stress bead analysis in a
twin screw extruder,” SPE ANTEC Tech. Papers,
(2012).
11. W. Pappas, G. Fukuda, H. Brown II, and D. Bigio,
Characterization and Comparison of Stress History in
a Twin-Screw Extruder Using Residence Stress
Distributions, Polymer Engineering and Science,
(2012).
Return to
Paper of the Month.