Three Dimensional Simulation of Coextrusion in a Complex Profile Die
Mahesh Gupta
Michigan Technological University Plastic Flow, LLC
Houghton, MI 49931 Houghton, MI 49931
Abstract
Mesh partitioning technique is used to simulate bilayer coextrusion in a complex profile extrusion die. Mesh partitioning technique allows coextrusion simulation without changing the finite element mesh as the interface between the adjacent polymer layers is changed during a coextrusion simulation. Since the finite element mesh in the die remains fixed during the simulation, the mesh partitioning technique allows coextrusion simulation even in highly complicated profile dies. Effect of polymer viscosity on interface shape, velocity, pressure, shear rate, and residence time distribution in a profile coextrusion die is analyzed. It is found that polymer viscosity has significant effect on the interface shape, velocity, pressure, and shear rate, but only a minor effect on the residence time distribution in the die.
Introduction
Coextrusion, which involves simultaneous extrusion
of several different polymers through a die to form a
single multilayered product, combines the functionalities
and benefits of several polymers into a single product [1].
Despite this inherent advantage of coextrusion, growth of
coextrusion market has been slowed down by the
complexity of coextrusion die design. Depending upon the
rheology of polymers used for coextrusion, the polymers
in various layers may get redistributed as they flow
through the die such that the distribution of various
polymers at the inlet and at the exit of the die may be
quite different. Because of this redistribution of polymer
layers, finding a die geometry which will give the
required layer distribution in the final product can be
extremely difficult.
Coextrusion dies are currently designed using a “trial
and error” approach. This repetitive approach is not only
highly time-consuming and costly, but also requires
highly experienced engineers and rarely provides an
optimum die design. Therefore, a coextrusion simulation
software, which can accurately predict the shape of the
interface between different polymer layers, is an excellent
design-aide for a coextrusion die designer. A coextrusion
software not only tremendously simplifies the coextrusion
die design process, the software can also be exploited for
a proper selection of the material in different layers and
for optimization of the processing conditions.
Coextrusion Simulation Equations
For simulation of a multilayer flow of polymers
during coextrusion, the velocity and stresses are required
to be continuous across the interface between the adjacent polymer layers [2]. That is,

where I contains all finite elements nodes on the interface, v(vector)
i(1) and τ~
i(1) are the velocities and stresses on one side of the interface, with v(vector)
i(2) and τ~
i(2) being the velocities and stresses on the other side of the interface. Besides the continuity of velocity and stress, coextrusion simulation requires enforcement of the no-cross-flow condition at the interface. That is, the velocity component normal to the interface must be zero at all interface nodes:

where v(vector)
i is the velocity, and n(vector)
i is the unit vector perpendicular to the interface.
Mesh Partitioning Technique
In most three-dimensional simulations of coextrusion
reported in the literature, finite element mesh is modified
after each flow simulation iteration, such that the interelement
boundaries coincide with the interface between
adjacent layers of different polymers [2]. Such an
approach using an interface-matched finite element mesh
can only be employed for simulating a two-dimensional
system or a simple three-dimensional system such as a
rectangular die. For real-life coextrusion systems, with
complex three-dimensional die channel geometry,
repeated generation and modification of interface-matched
finite element meshes is impractical.
In the present work, polyXtrue software [3] was used
to simulate the flow in a bi-layer profile coextrusion die.
In this software a three-dimensional mesh of tetrahedral
finite elements is generated over the complete flow
domain in the die. This finite element mesh is not
modified or regenerated at any stage during coextrusion
simulation. Thereby, allowing simulation of even highly
complex coextrusion systems.
In the coextrusion software used in this work, the
interface between adjacent layers of different polymers is
represented by a surface mesh of linear triangular finite
elements. However, the surface mesh of triangular
elements on the interface and the three-dimensional mesh
of tetrahedral elements in the coextrusion die are
completely independent of each other. This decoupling
between the two finite-element meshes is possible because
in the mesh partitioning technique for coextrusion
simulation, the interface between adjacent polymer layers
is not required to match with the inter-element boundaries in the three-dimensional mesh of tetrahedral finite
elements. Instead, in the software used in this work, the
interface is allowed to pass through the interior of the
tetrahedral finite elements in the three-dimensional mesh.
In the mesh partitioning technique for coextrusion
simulation, the tetrahedral elements which are intersected
by the mesh of triangular elements on the interface are
partitioned into two three-dimensional finite elements.
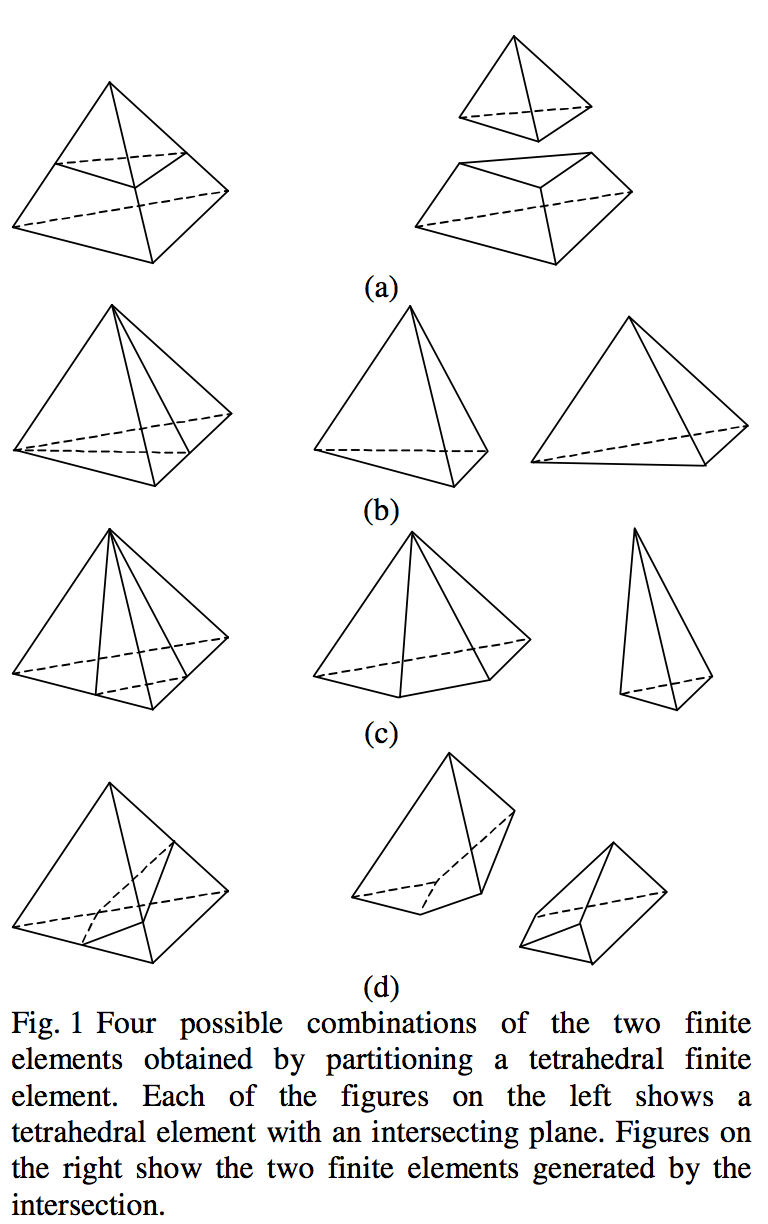
When a two-dimensional plane intersects a tetrahedral
finite element, it leads to one of the following
combinations of two finite elements.
o One tetrahedral and one prismatic element (Fig. 1 a),
o Two tetrahedral elements (Fig. 1 b),
o One pyramidal and one tetrahedral element (Fig. 1 c)
o Two prismatic elements (Fig. 1 d).
In the coextrusion software used, each of the tetrahedral
elements which are intersected by the interface between
adjacent polymer layers is replaced by one of these four
combinations of the two finite elements.
Prediction of Interface Shape
The shape of the interface between adjacent polymer
layers is defined by the no-cross-flow boundary condition
(Eqn. 3). In the coextrusion software used in this work, a
weighted residual form of Eqn. 3 is solved to predict the
interface shape [4].

where I
s is the space of weighting functions (same as the shape functions) on the interface and Γ denotes the interface surface.
In our earlier publication [5] on coextrusion
simulation for simpler extrudate shapes, an initial estimate
of the interface shape had to be specified as an input to the
coextrusion software. Starting with the initial estimate of
the interface shape, the earlier version of the software then
accurately predicted the interface shape between the
adjacent polymer layers. For complicated profile
coextrusion dies, such as the die analyzed in this work, it
is difficult to determine the initial estimate of the interface
between the adjacent polymer layers. Therefore, in the
current version of the polyXtrue software, using the
streamlines for the flow simulation in the previous
iteration, an initial estimate of the interface between the
adjacent polymer layers is automatically determined by
the software. This initial estimate of the interface shape
obtained from the streamlines for the previous flow
iteration is then updated according to the predictions from
the weighted residual form of the no-cross-flow condition
(Eqn. 4).
Resins
The generalized Newtonian formulation for an
inertialess, incompressible flow with shear-thinning
viscosity was used for the coextrusion simulations. To
simulate a multilayer flow in coextrusion dies, two different grades of low-density polyethylene (LDPE) were
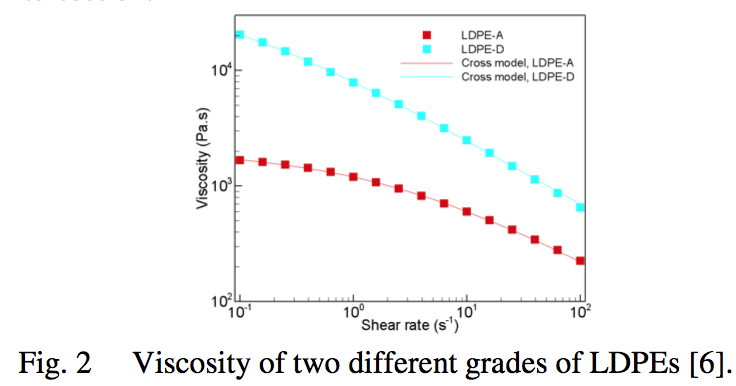
used in this work. The shear viscosity data at 200oC for
the two grades of LDPE is shown in Fig. 2. Experimental
data from reference [6] (Fig. 2) was used to obtain the
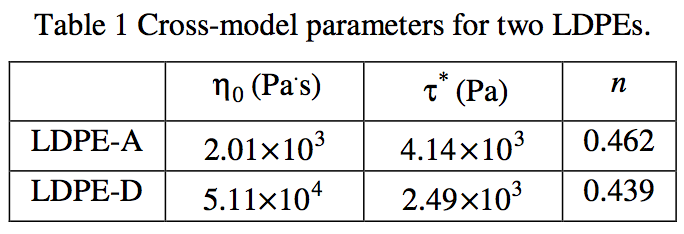
parameters for the Cross model (Table 1).

Fig. 2 also shows the viscosity curves based upon the
Cross model parameters given in Table 1.
Results and Discussion
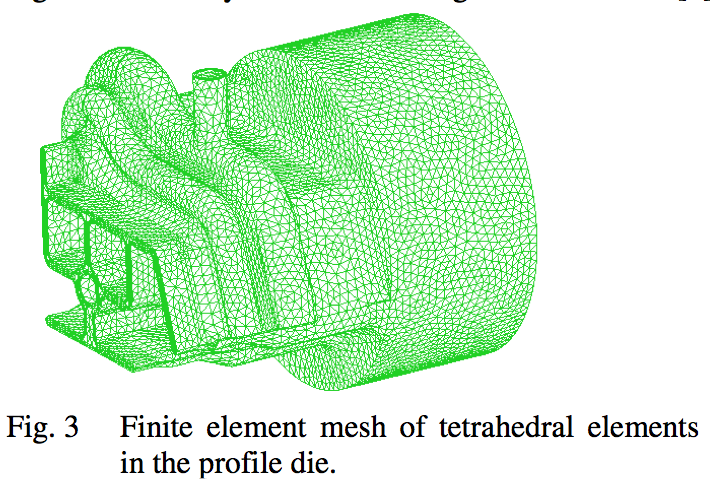
The geometry of the complex profile die analyzed,
and the mesh of tetrahedral elements used for coextrusion
simulation is shown in Fig. 3. Most of the extruded profile
(substrate) is made of one polymer, but it has a thin cap
layer on the top wall. As shown in Fig. 4, the cap layer
also wraps around the vertical tab on the left side of the
part. For substrate of the profile the polymer enters along
the axial direction into a circular channel which is
gradually transformed into the profile shape. The cap
layer enters through a circular channel on top, which is
perpendicular to the die axis. In order to distribute the
polymer from the circular channel to the thin cap layer,
the circular channel is followed by two distribution
channels. Both distribution channels have circular crosssections,
and are connected by a channel with uniform
narrow opening. Because of the narrow channel between
the two distribution channels, the polymer first flows
along the transverse direction and is distributed in the first
distribution channel before it enters into the second
distribution channel. The second distribution channel is
connected to the entrance of the cap layer in the die, again
by a narrow channel which further distributes the polymer
in the second distribution channel before the polymer
uniformly reaches the contact line where the cap layer
meets the substrate for the first time.
The flow in the bi-layer profile die was simulated for
the following three different combinations of LDPE-A
and LDPE-D in the substrate and the cap layer.
Substrate | Cap layer
LDPE-A | LDPE-A
LDPE-A | LDPE-D
LDPE-D | LDPE-A
For these three combinations of LDPE-A and LDPE-D,
the velocities at the circular entrances of the substrate and
cap layer were 0.1 cm/s and 1.5 cm/s, respectively. These
values of entrance velocities were used so that the
velocities of the two polymers are similar when the two
polymers come in contact inside the die. The bi-layer flow
in the die was also simulated for entrance velocity of 3.0
cm/s for the cap layer, while keeping the entrance velocity
for substrate to 0.1 cm/s
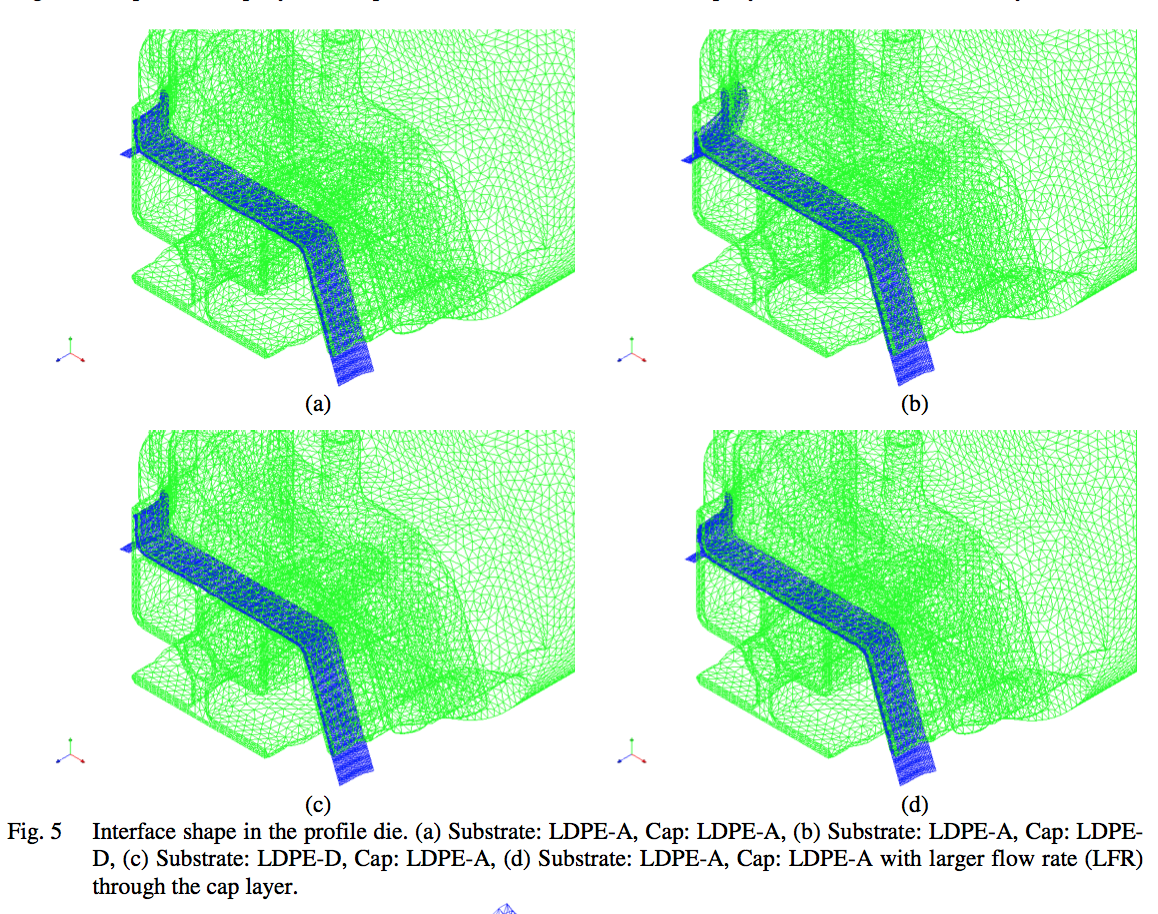
For the three different combinations of LDPE-A and
LDPE-D, as well as for the case with larger flow rate (LFR) through the cap layer, Fig. 5 shows the predicted
interface shape between the two layers. In Fig. 5, all four
interface profiles look very similar, except for the
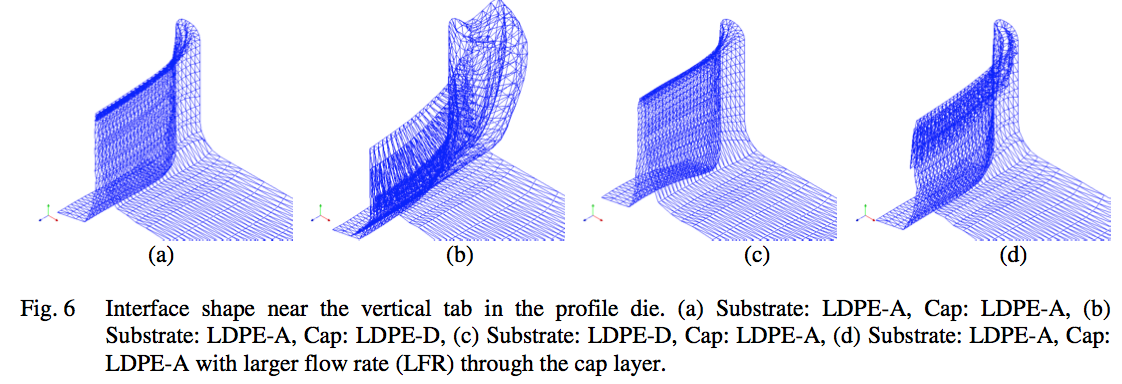
interface shape in Fig. 5 (b). In Fig. 5 (b), the interface
shape near the contact line in the vertical tab on the left
where the cap layer wraps around the substrate is quite
different than the interface shape for the other three cases.
This difference in the interface shape for the case with
higher viscosity polymer (LDPE-D) in the cap layer and
lower viscosity polymer (LDPE-A) in the substrate is
further clarified in Fig. 6. When the viscosity of the
polymer in the cap layer is the same (Fig. 6 a, d) or lower
(Fig. 6 c) than the viscosity for the polymer in the
substrate, after the two polymers come in contact at the
contact line, the interface between the two layers goes
towards the exit along the axial direction. However, for
the case with higher viscosity polymer in the cap layer
(Fig. 6 b), in the vertical tab on the left where the cap
layer wrap around the substrate, the interface first goes
toward the entrance before reversing back and starting to
move toward the exit. It was confirmed that for this case
with the higher viscosity polymer in the cap layer, the
polymer velocity in this region near the vertical tab is in
fact towards the entrance. Because of this initial
movement of the interface towards the entrance, for the
case with the higher viscosity polymer (LDPE-D) in the
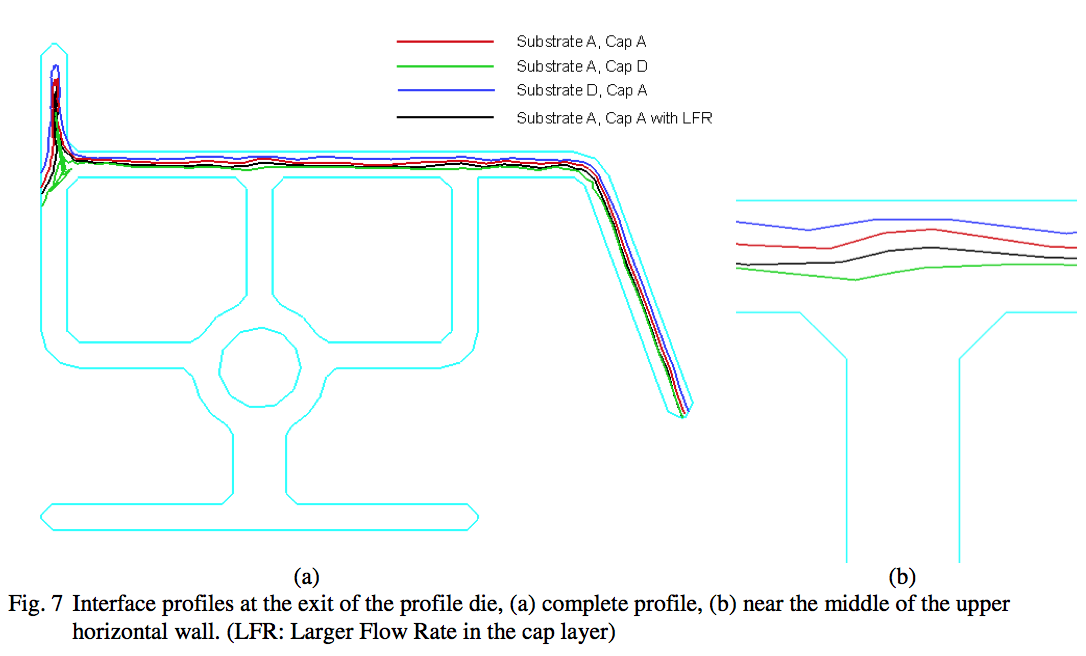
cap layer, the vertical tab on the left is almost completely
occupied by the higher viscosity polymer (green line in
Fig. 7). That is, for this case there is almost no substrate
polymer in the vertical tab. For the horizontal wall on top
of the extrudate profile, effect of the polymer viscosity on
the interface location at the die exit is shown in Fig. 7 (b).
Effect of viscosity on the interface location in the
horizontal wall can be explained by examining the
velocity distributions shown in Fig. 8. In comparison to
the case with low viscosity polymer (LDPE-A) in the
substrate as well as the cap layer (Fig. 8 a), for the case
with higher viscosity polymer (LDPE-D) in the cap layer
(Fig. 8 b), the velocity of the polymer in the cap layer is
lower at the die exit. Therefore, in Fig. 7 (b) in order to
satisfy the mass balance, the interface in the horizontal
wall at the die exit is lower for this case (green line). In
contrast, for the case with higher viscosity polymer
(LDPE-D) in the substrate and the lower viscosity
polymer (LDPE-A) in the cap layer, as expected, the
velocity in Fig. 8 (c) is higher in the cap layer. Therefore,
in order to satisfy the mass balance, the interface for this
case is located at the highest position in Fig. 7 (b) (blue
line). That is, the cap layer is the thinnest for this case. It
is evident from Fig 7 (a) that the cap layer for this case
may be too thin in the region where the vertical tab on the
left connects with the horizontal wall. In this region where
the vertical tab is joined with the horizontal wall, for the
case with higher viscosity polymer (LDPE-D) in the
substrate, the interface is almost touching the die wall.
That is, for this case there may not be any cap layer in this region where the vertical tab connects with the horizontal
wall. For the last case with LDPE-A in the substrate as
well as the cap layer, but larger (double) flow rate in the
cap layer, (Fig. 8 d, and black line in Fig 7), as expected,
the interface is lower in comparison to the case with
smaller velocity in the cap layer and with LDPE-A in both
layers (red line in Fig. 7).
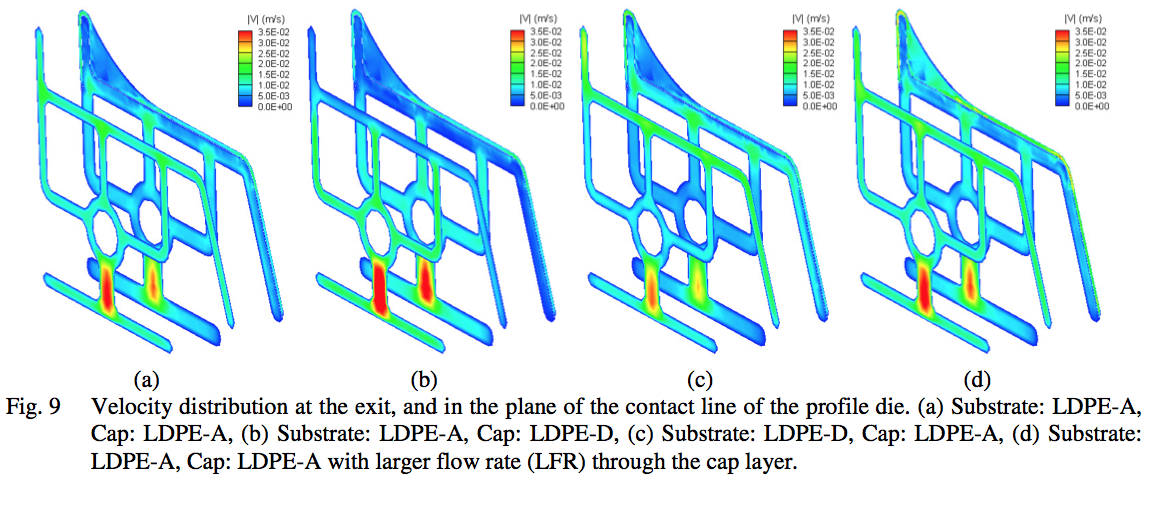
For the three cases with different polymer
combinations and the case with larger flow rate (LFR)
through the cap layer, the velocity distribution at the die
exit and the velocity distribution in the plane where the
cap layer first comes in contact with the substrate are
shown in Fig. 9. It should be noted that the range of scale
bars in Fig. 8 and Fig. 9 are different. For all four cases,
the flow in the substrate is not very well balanced. In
particular, the velocity is significantly higher in the
vertical wall connecting the circle in the middle with the
bottom horizontal wall. This higher velocity in the vertical
wall can be easily reduced, that is, the floor at the die exit
can be easily balanced, by reducing the opening in this
region in the die plates between the circular entrance and
the final die plate at the exit.
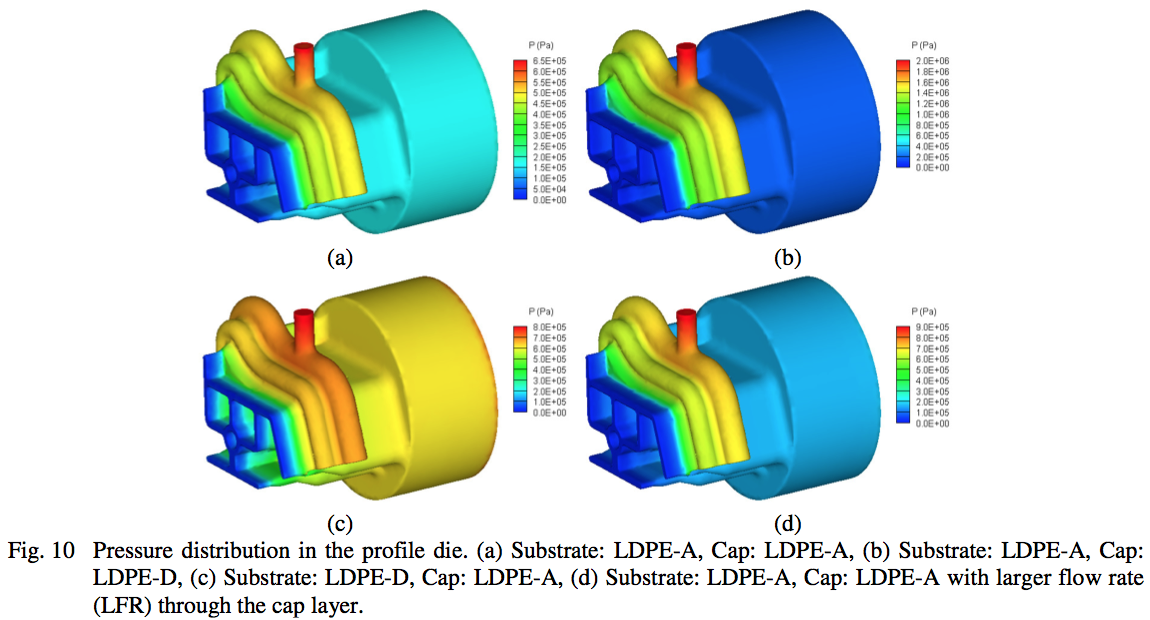
Fig. 10 shows the pressure distributions for the four
coextrusion simulations in the profile die. As expected,
the pressure is zero at the exit, and because of its smaller
cross-section and higher velocity, the pressure is the
highest in the circular channel at the entrance of the cap
layer. In comparison to the pressure for the case with
LDPE-A in both layers, the pressure in the die increases
when the higher viscosity polymer (LDPE-D) is used in
the substrate (Fig. 10 c) or in the cap layer (Fig. 10 b).
Also, the pressure in the two distribution channels and the
circular entrance channel increases for the case with larger
flow rate in the cap layer (Fig. 10 d).
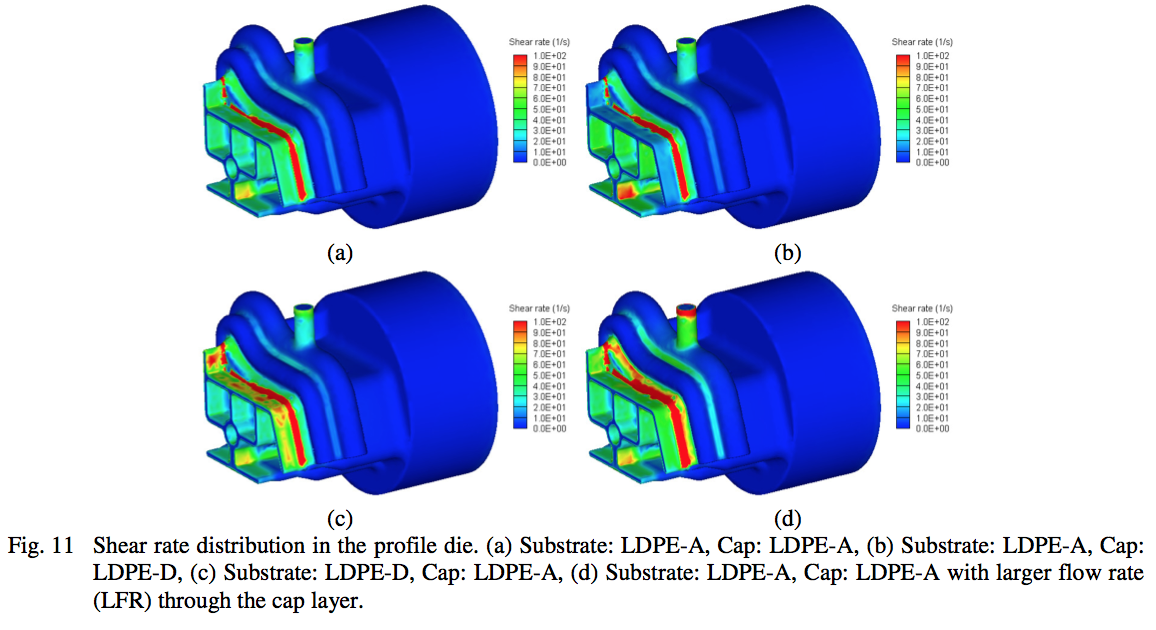
The shear rate on the die walls for the four
coextrusion simulations is shown in Fig. 11. For all four
cases the shear rate is the highest in the cap layer in the
plane where it meets the substrate for the first time. Also,
it is noted that after the two polymers meet, the shear rate
in the cap layer is higher for the case with the higher
viscosity polymer (LDPE-D) in the substrate (Fig. 11 c)
because after the two polymers meet the velocity in the
cap layer is higher for this case (see Fig. 8 c). For the case
with higher velocity through the cap layer (Fig. 11 d), as
expected, the shear rate is higher in the narrow channel
connecting the two distribution channels for the cap layer
and in the narrow channel connecting the second
distribution channel with the contact line where the two
polymers meet.
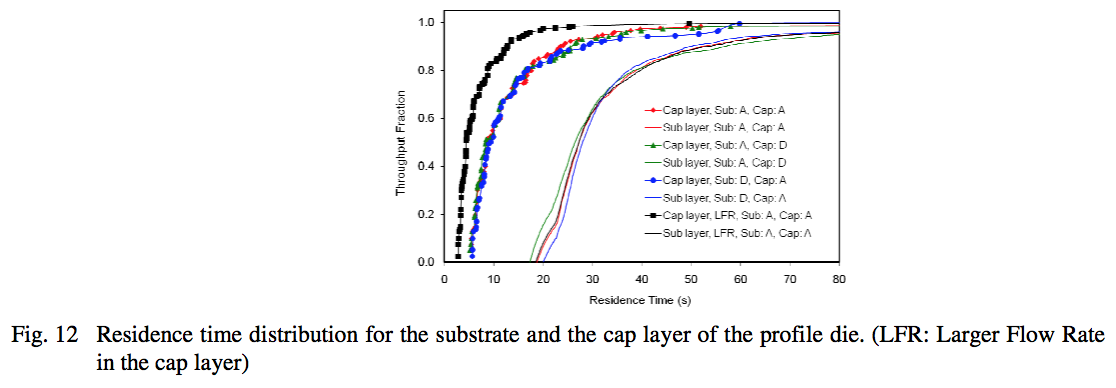
Fig. 12 shows the residence time distributions for the
polymers in the substrate and the cap layer. In Fig. 12, for
the four coextrusion simulations, the residence time for
the substrate is much larger than the residence time for the
cap layer. The larger residence time for the substrate is expected because the circular entrance channel for the
substrate has a larger cross-sectional area. Accordingly, a
smaller velocity (1 mm/s) was specified at the entrance of
the circular entrance channel for substrate, whereas a
much higher velocity (1.5 cm/s or 3.0 cm/s) was specified
at the entrance of the circular entrance channel for cap
layer. Also, as expected, the residence time for the cap
layer is smaller for the case with larger flow rate through
the cap layer (black line with square symbol in Fig. 12).
For the three cases with different polymer combinations in
the substrate and the cap layer, even though the residence
time distribution for the cap layer (and also for substrate)
are different for different polymer combinations, the
difference in the residence time for the cap layer (and also
for substrate) for the three cases is small, and is probably
within the accuracy of the predictions. That is, for the
three different polymer combinations, viscosities of the
polymers seem to have only a minor effect on the
residence time distribution.
Conclusions
Mesh partitioning technique was used for simulation
of a bi-layer coextrusion in a complex profile die. Since
the mesh partitioning technique does not require the
interface between different polymer layers to match with
the inter-element boundaries (instead, allowing the
interface to cut through the tetrahedral finite elements),
this technique could be used to simulate the flow in a
highly complex bi-layer coextrusion die. Effect of
polymer viscosity on interface shape, velocity, pressure,
shear rate, and residence time distribution was analyzed.
Viscosities of the two polymers were found to have
significant effect on the interface shape, velocity,
pressure, and shear rate in the die, but only a minor effect
on the residence time distributions of the two polymers.
References
1. C. Rauwendaal, “Polymer Extrusion”, Hanser Publishers, New York (1994).
2. A. Karagiannis, A. N. Hyrmak, and J. Vlachopoulos, Rheologica Acta, Vol. 29, 71 – 87 (1990).
3. PolyXtrue software, Plastic Flow, LLC, Houghton, MI, 49931.
4. J. Dheur and M. J.Crochet, Rheologica Acta, Vol. 26, 401 – 413 (1987).
5. M. Gupta, SPE ANTEC Technical Papers, Vol. 54, 217 – 222 (2008).
6. J. Dooley and L. Rudolph, Journal of Plastic Film and Sheeting, Vol. 19, 111 – 123 (2003).


Return to
Paper of the Month.