A Pertubation Method to Characterize Melting During the Extrusion of Polymers and Blends
Mark D. Wetzel, Donald A. Denelsbeck, Susan L. Latimer - E. I. du Pont de Nemours and Co., Inc.
Chi-Kai Shih - Chi-Kai Shih, L.L.C.
Abstract
By means of a novel flow perturbation technique, fundamental details during the extrusion of semicrystalline and amorphous polymers, such as Polypropylene (PP), Polystyrene (PS), or PP/PS polymer blends can be analyzed with respect to the kinetics of melting and energy input. The effects of extrusion conditions such as throughput and screw speed were examined. A specialized, high-speed data acquisition system, the “Extrusion Pulse Analysis System” (EPAS) has been employed to enable on-line monitoring and data analysis based on an imposed mass disturbance to provide a real-time diagnosis of extrusion melting processes in laboratory and manufacturing applications.
Using the power response profile of the mass perturbation, four key sequential stages of melting have been proposed for twin-screw extrusion of a single component or polymer blends. A “lubricated melting” mechanism is also proposed for the extrusion behaviors of PP/rubber and PS/rubber blends using an Ethylene copolymer and SBS block copolymer as the minor phase ingredient.
Introduction
The “Pulse Technique” is an experimental method developed to probe the process dynamics of an extruder [1]. A material mass pulse is introduced into the extruder feed, superimposed onto the steady-state flow rate. The drive motor power response reflects the additional energy input to the pulse material above a baseline value. The dynamic response can be monitored at discrete axial or radial locations using pressure transducers, temperature sensors, residence time distribution (RTD) probes [2] and other devices. A material impulse is used to excite all dynamic modes of the system. The response decays to the baseline providing information about the steady state. In this work, motor power and RTD measurements were used to quantify melting zone performance of an intermeshing, co-rotating twin-screw (T/S) extruder.
The feed impulse addition and subsequent motor power response are unique to starve-fed extruders. Conceptually, the following sequence is proposed; 1) at time 0, the pulse material is dropped into the feed port and is conveyed forward axially in the partially-filled transport section with the feed material, 2) the pulse/feed mixture reaches the first point of fill or kneading block perturbing the steady-state solid and fluid flows in the melting section, 3) the additional mass propagates and spreads axially and 4) the material exits the extruder and the system returns to the baseline steady-state condition. Due to the short duration of the disturbance, the mechanical energy input dissipates quickly without much effect to the extrusion process. The power signal represents the time, temperature and stress history of the material addition and its interaction with the steady-state melting process. By varying the amount or composition of the pulse material, the power response provides quantitative information about the melting transition. By adding a tracer to the pulse material, the RTD response of mass perturbation in the melting zone can be used to identify the melting zone contribution to the power response. The pulse response is sensitive to operating conditions, including throughput, screw speed and barrel temperature, providing important information about the dynamics of the steady state.
The pulse power response in time should correspond to the melting sequence identified using different experimental methods [3, 4 and 5]. These key steps are; 1) free-flowing pellets in a partially-filled screw channel generally moving in an axial displacement mode, consuming little mechanical energy, 2) compaction and frictional heating at the start of the fully-filled melting zone followed by bulk plastic deformation (PED), consuming a significant amount of mechanical energy, 3) lubrication by the first formation of a melt phase causing a transitional flow, and 4) viscous flow and energy dissipation (VED) in the liquid phase in the presence of un-melted solids with heat transferred to the solid phase. These mechanisms may overlap, and in the case of blends, lubrication by one component could cause the VED mode to dominate for most of the melting section. A batch mixer fitted with a glass window was used to link the pulse power response to these melting mechanisms [3]. A simple on-line analysis method is proposed to probe the compounding process and help resolve important production issues, including determining optimum operating conditions and assessing if the process running the same as it has in the past. This paper presents initial findings with the perturbation method applied to melting and shows its utility as an aid to monitor and diagnose a compounding process.
The pulse mass causes a significant perturbation of solid and fluid mechanics in the melting, mixing and pumping regions of the screw, demanding careful interpretation. The conservative approach is to treat the pulse response as a process signature, or spectrum, and analyze differences between time profiles. Optimistically, one can pin the time response to locations on the screw and quantify the physics of melting. In reality, the interpretation is somewhere in between. Limitations of the method are due to process or sensor noise and drift. In some systems or operating conditions, the pulse response lacks sensitivity to small changes in flow rate, viscosity, temperature and composition, yet the pulse technique applied to melting does indeed capture the effects of material properties and process conditions.
Experiment
Model systems were used to demonstrate the pulse technique as applied to melting in T/S extrusion:
I. Semi-Crystalline Polyolefin: Polypropylene (PP) (Atofina 3480Z) [6]
- TM = 167oC, 4.8 MFR
II. Amorphous Polymer: Polystyrene (PS) (Dow Styron® 666D) [6]
- Tg = 100oC, 8.0 MFR
III. Blends and Lubricated Melting
- PP/PS
- PP/EP Rubber (DuPont Dow Engage® 8180)
- PP/SBS (Kraton Polymers Kraton® D1107)
- PS/SBS and PS/EP
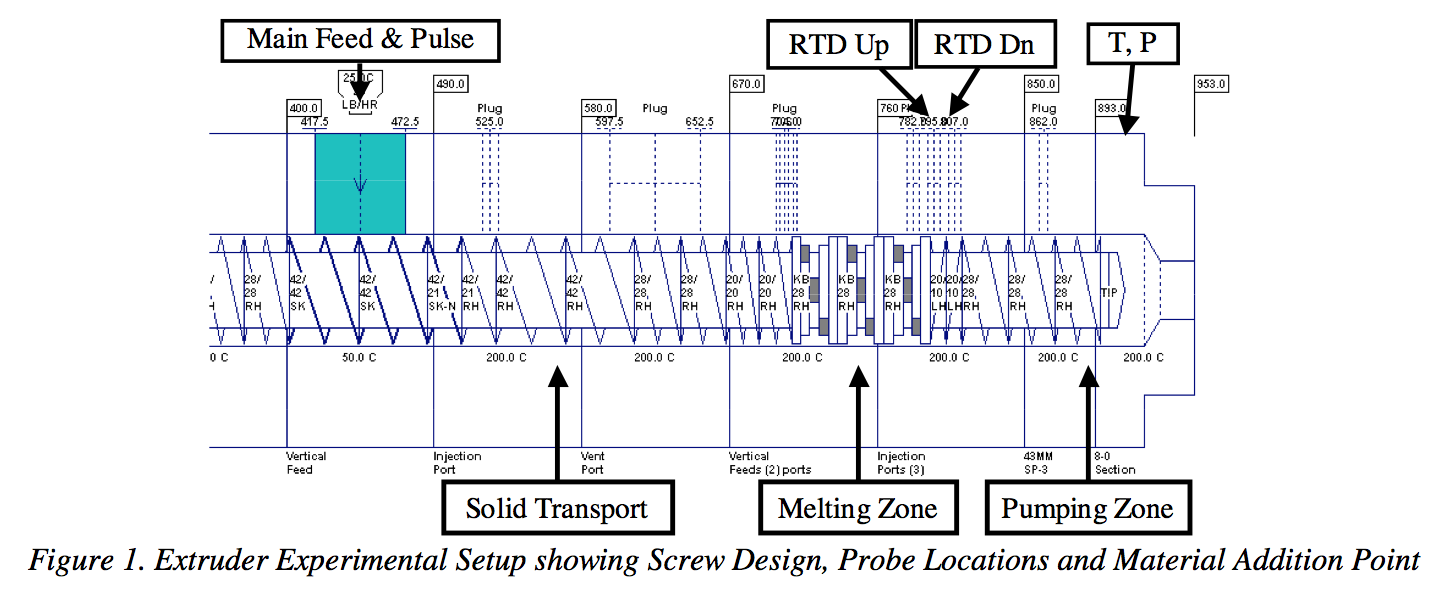
Experiments were conducted on a Coperion W&P ZSK-30mm co-rotating T/S extruder. Fig. 1 shows the screw configuration with a melting zone and the probe locations. For each pulse material, an additional 0.5gm of a 20% by weight TiO2 concentrate in PP, PS or rubber was added as the RTD tracer. The “Extrusion Pulse Analysis System” (EPAS) [1] was used to capture melting zone measurements. Optical RTD probes [2] were mounted at the end of the melting zone over reverse- pumping conveying elements. In the melting experiments, data scanned at 60Hz were decimated to 20Hz and filtered with a 3-tap median filter. In spite of filter- ing, significant noise levels remain so the pulse tests are replicated from 2 to 10 times and averaged to improve the signal to noise ratio. For these experiments, EPAS test time was set to 4 minutes starting with a 90 second baseline recording. Batch mixer melting experiments were run on a Brabender Plasticorder to examine PP, PS and blends melting as a function of time and link phase transition stages to those in the extruder and pulse response. The barrel was set to a constant temperature of 200°C, the material was compacted with a 5kg weight, the torque and melt temperature were monitored with the EPAS system and a glass window was used to visualize the process.
Discussion of Results
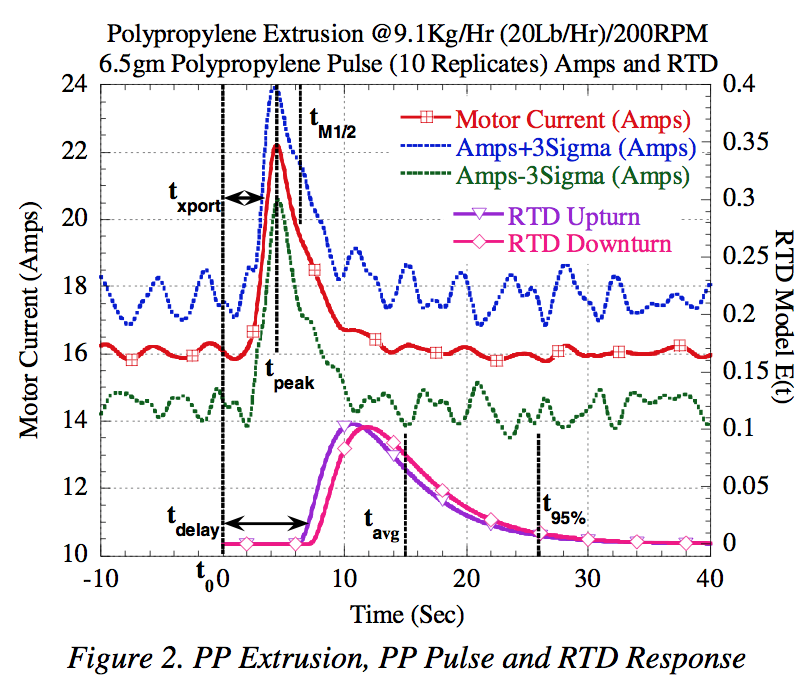
Fig 2 shows a typical melting zone pulse response for the PP system running at 9.1hg/hr and 200RPM. The motor amperage (and power) is a V-shaped profile superimposed on top of the steady state baseline. The power increase corresponds to the additional mechanical energy input as the pulse material advances through the channels of the working section. After the pulse introduction, a 2s transport delay (t
XPORT) with little or no additional energy input is followed by a sharp rise in power, peaking at 4.5s (t
PEAK), then decaying to the baseline by 25s. The amperage profile was generated from the time average of ten replicate pulse tests. The point-by-point ±3σ bands show that the variability during the disturbance remains constant. With 10 replicates, subtle transitions in the amperage (and power) profiles are revealed. After the melting peak at 4.5s, there is a change in the decay slope at 5.5 to 6s. This shoulder occurs before the 6.9s minimum residence time. This may indicate the axial location between the second kneading block and first reverse pumping element. For all other states, four replicates were selected as a compromise between amplitude resolution and time available to complete the experiments.
The RTD’s in Fig 2 were computed from the optical probe responses to the TiO
2 tracer concentrate added to the pulse material
[2]. In the melting zone, it was found that noise in the reflected light signal was an indicator of incomplete melting or poor distributive mixing of the tracer in the matrix. With the exception of very high rate states, noise levels were very low, suggesting that melting was complete with good distributive mixing. From a Weibull distribution model fit, the minimum (t
DELAY), mean (t
AVG), and 95% (t
95%) residence times were estimated. The characteristics of these RTD profiles are very similar to those of melt mixing zones
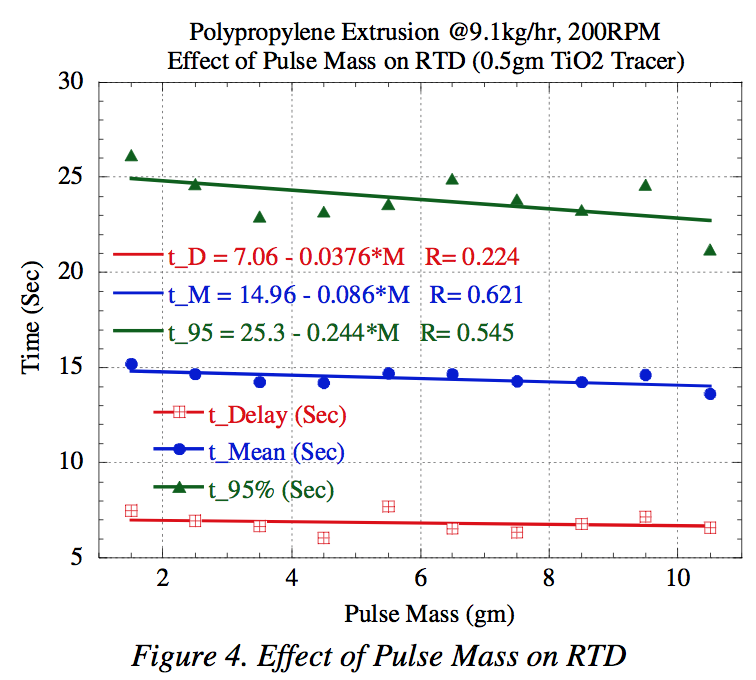
[2, 4]. As shown in Fig 4, it was found that there was little difference in the RTD shape when 0.5gm tracer was added to 1 to 10 gms of pulse material indicating that the mass perturbation in a single component system does not introduce a prolonged, significant change to the underlying flow and physical transformations.
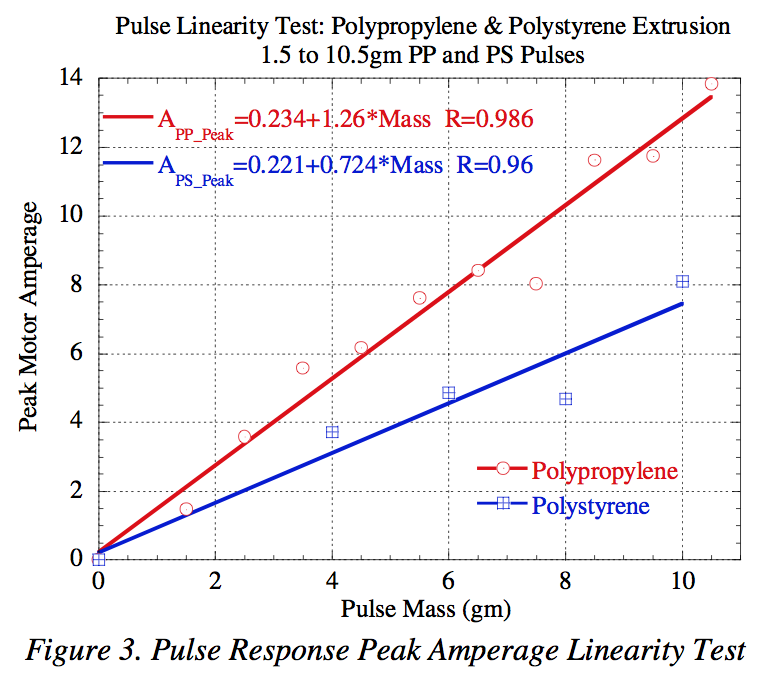
The effect of pulse mass on linearity was evaluated for PP and PS extrusions. Fig 3 shows the motor amperage peaks for duplicate tests as a function of pulse mass at 9.1kg/hr and 200RPM. The pulse amount is selected so the peak should exceed three times the baseline peak-to-peak noise level (2.5A for PP and 2.8A for PS). The mass impulse may represent a momentary throughput increase of 100% to 300% above the steady-state rate at the feed throat and start of the melting zone. The pulse peak is approximately linear with pulse mass for PP and PS. Above 10.5gm, it is possible that the system response may become nonlinear (from overfilling the screws or over-torque). Scatter in the peak data was due to the use of only two replicate tests for each level. PS exhibited more noise and variability relative to the baseline amperage level. The power response shape changed little with pulse mass. The specific energy input was calculated by integrating the area under the power and dividing by pulse mass. The pulse response was approximately linear with pulse mass since the normalized specific energy curves were very similar. This is another indication that the mass perturbation does not introduce a significant change to the melting process. For all experiments, 6gms of the pulse material plus 0.5gms of RTD tracer concentrate (in the pulse or feed polymer) were used.
Semi-crystalline Polymer Melting: Polypropylene
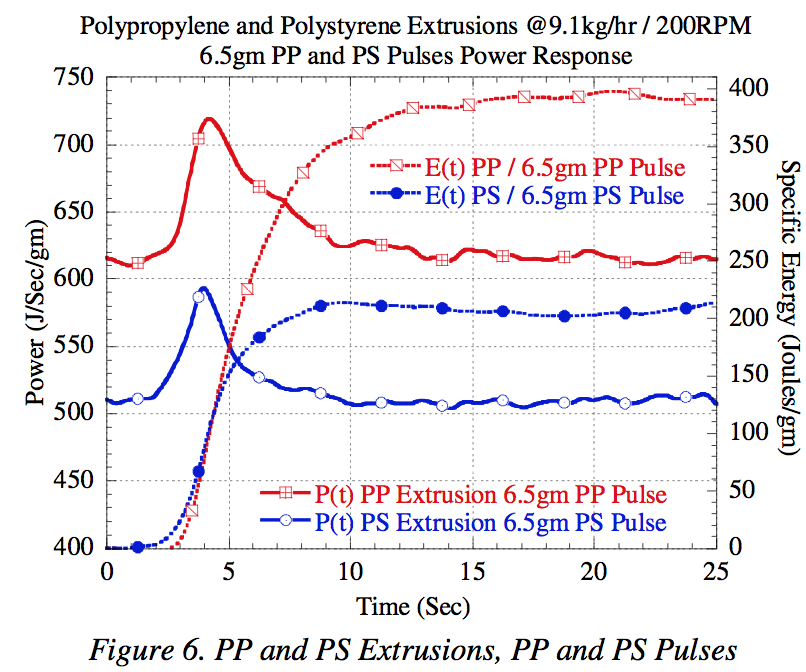
At 9.1kg/hr and 200RPM, the specific energy profiles shown in Fig 6 and 7, PP pulses produce a total energy input of 400J/g in 17s and t
M 1/2 is 5.5s. From DSC data, the enthalpy change from 20
oC to 180
oC is 540J/g. The pulse energy does not account for the enthalpy re- quired for a 206oC melt temperature. From Fig 2, most of the power decays to the baseline before the mean residence time. This profile is consistent with the sequential melting mechanisms described in [3, 5 and 6].
The RTD provides an axial location on the screw that helps pin the power response to the screw design. A dimensionless number is defined to the quantify the power response relative to the residence time:
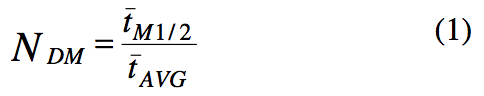
where t
M 1/2 is the characteristic melting half time extracted from the specific energy input curve.
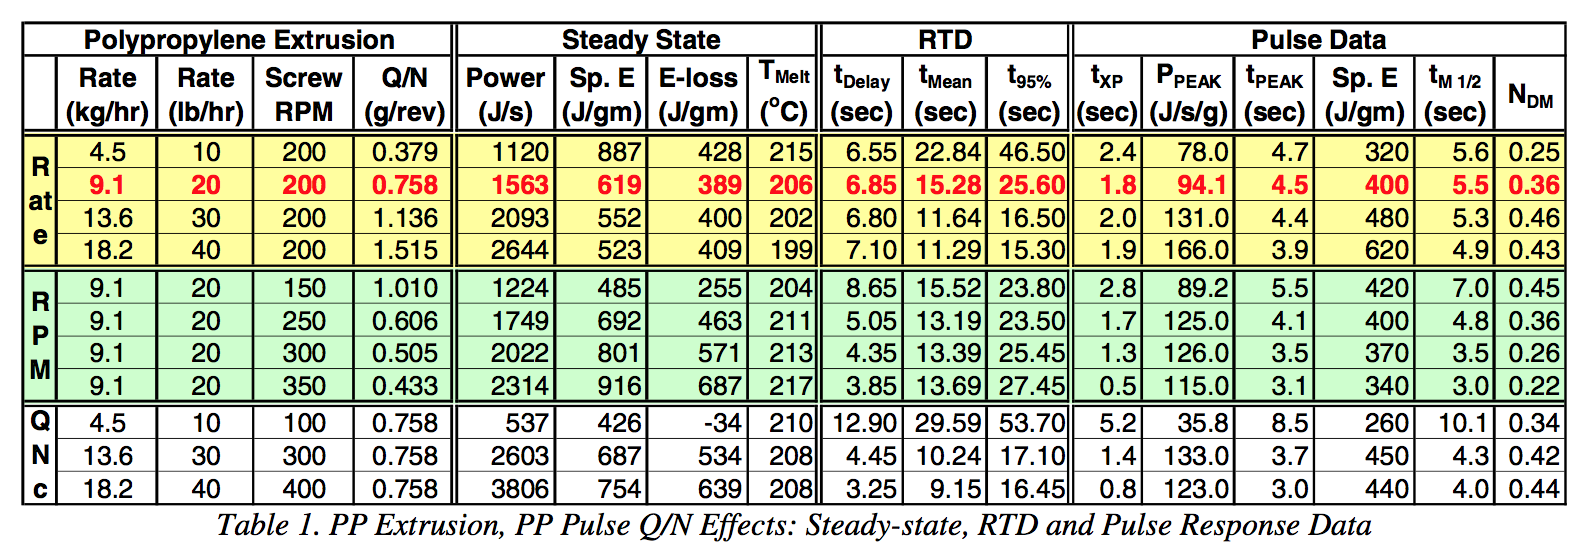
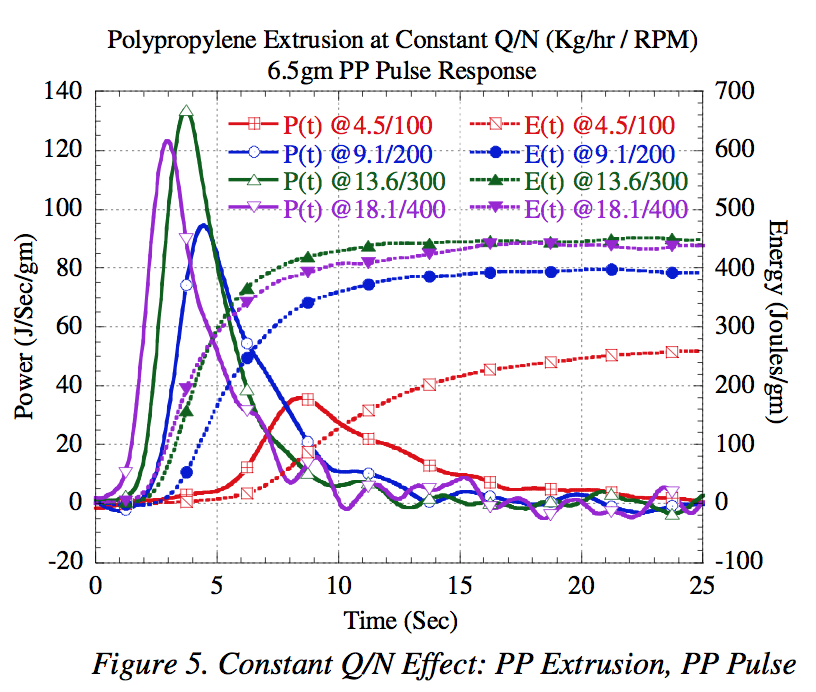
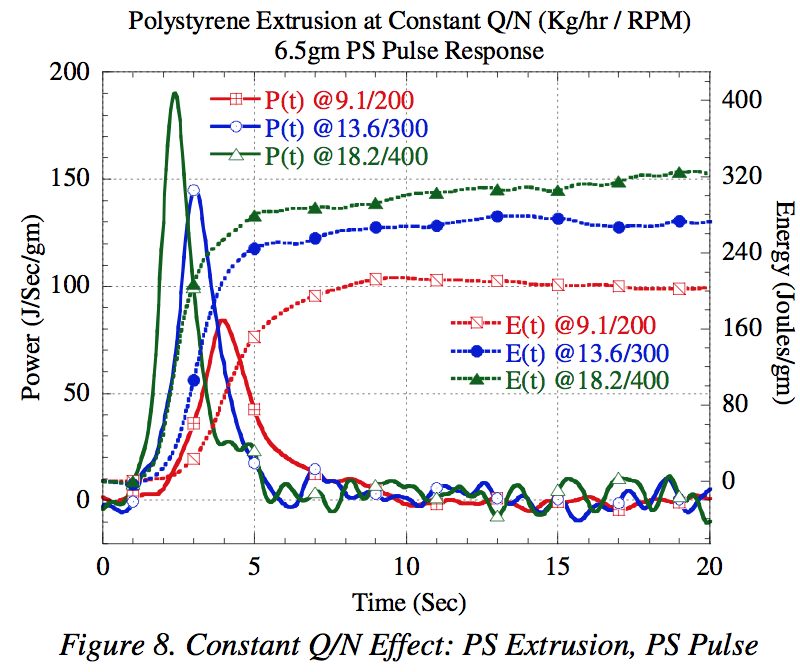
The pulse response is sensitive to extrusion rate and screw speed. Table 1 summarizes steady state, pulse and RTD data as a function of Q/N. Fig 5 shows the combined rate and screw speed effects for constant Q/N. Assuming the melting physics are the same in a LDPE system [6], the upstream shift and increase in pressure peaks can be associated with the same trends in the pulse power peak. From LDPE visualization experiments, the filled length of the melting zone increases with rate, decreasing the transport and pulse peak times. As RPM is increased, the specific energy and NDM decrease. RTD time values follow the same trends with Q and N ob- served for melt mixing zones [2, 4]. The pulse power profile transport delay and spread are reduced with increasing Q and N. The peak power reaches a maximum at 13.6kg/hr and 300RPM, but is reduced at 18.2kg/hr and 400RPM. The power profile may show the relationship between the linear reduction in RTD with Q/N and the nonlinear viscous shear heating effect with N.
Amorphous Polymer Melting: Polystyrene
Fig 6 shows PP and PS extrusions at 9.1kg/hr and 200RPM. For PS, the baseline power is lower than PP. The pulse power curve transport delay and initial rise are similar, but the peak is lower and decay to the baseline is more rapid. The pulse specific energy profile shows the same rate of energy input in the initial melting stages, but PS reaches a final value of 220J/gm in 10s while t
M 1/2 is 4.3s. Thus, the initial stages of melting appear to be similar for PP and PS, but PS enters the viscous dissipation mode more rapidly than PP. This is consistent with melting enthalpy differences (540J/gm for PP and 220J/gm for PS) and observations by Gogos et. al. [5].
Overall, pulse response trends with Q and N of the PS system are similar to PP. The 6.5gm PS pulse peak response was low relative to the baseline noise introducing more variability. The trends are consistent as shown in Fig 8 for the constant Q/N test. Increasing Q and N shift the curves left and increase the peak and energy input as expected, but unlike PP, the PS 18.2/400 state peak was greater than the 16.3/300 peak. RTD’s of the PS system followed the same trends with Q and N as PP.
Energy Input: Relating Pulse and Steady State Data
In Table 1, the motor power, PSS, was normalized by Q to estimate the steady state specific energy, ESS. ESS is greater than the pulse specific energy, EP. ESS and EP may follow different trends with Q, N and Q/N. PSS is the power consumed by the entire polymer volume in the screws plus all losses. The loss term includes motor and drive inefficiencies, energy to turn “dry” screws, thrust bearing friction, and other sources. These losses are assumed to be constant in these experiments. By extrapolating to Q = 0, a power “loss”, PL, can be estimated from the PSS and Q relationship. For PP at 200RPM, PL is 580J/s and 695J/s for PS. This loss term consumes 25% to over 50% of the power input. Obviously, this method overestimates the electrical and mechanical inefficiencies of the extruder, and includes material-dependent energy consumption in the clearances. Adjusted power and specific energy, ESS-L, and EP are similar in magnitude, but ESS-L is nearly constant, independent of Q. However, for fixed Q and N, ESS-L and EP follow the same trends at similar magnitudes. When N is varied, this loss adjustment method may not be valid since the process cannot be extrapolated to 0 RPM. In Tables 1-4, ESS-L values use the power loss values estimated from the rate change tests. In this analysis, the power loss term may include viscous dissipation of the residual polymer in the clearances. This additional power consumption may be insensitive to Q, but is highly dependent on N and material properties as illustrated by the RPM and constant Q/N tests in PP and PS systems. These results indicate that the pulse response is not sensitive to these power losses. Furthermore at one operating condition, PP is linear with pulse mass and EP is constant. Thus, the pulse response captures the mechanical energy input of the additional material only, providing a quantitative time and intensity profile of the melting zone.
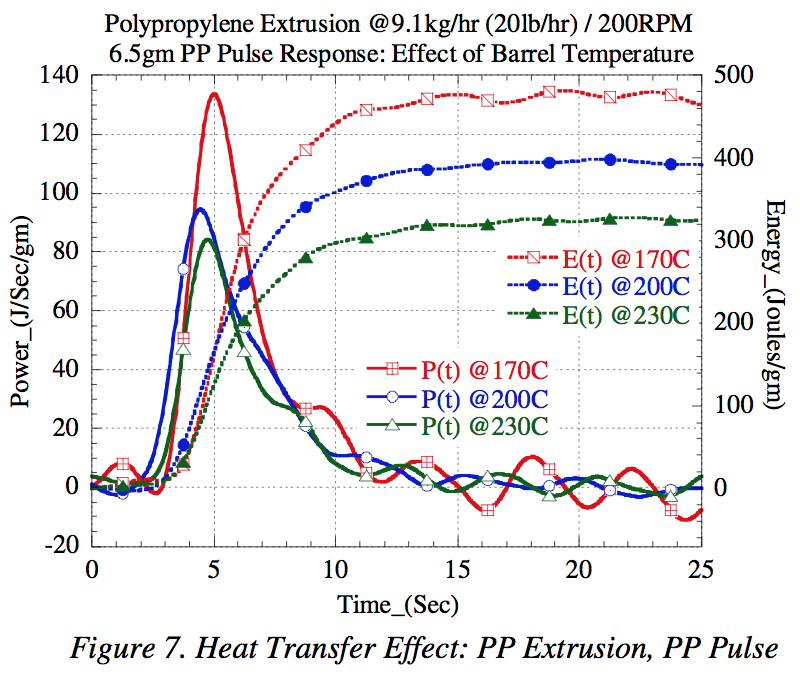
Heat Transfer and the Pulse Response
The pulse technique reveals the effect of heat transfer on the melting process. Fig 7 shows the PP extrusion power and energy profiles for three barrel temperatures. Pulse peak and energy input increase as barrel temperatures decrease. At 170
oC, the power peak increase is pronounced, indicating that more mechanical energy may be consumed in the compaction/friction, deformation (increased PP modulus [5]) and transition stages. The RTD does not change significantly, so NDM remains constant. For each 30
oC decrease, the pulse energy was increased by 80J/gm, or 2.7J/gm/C.
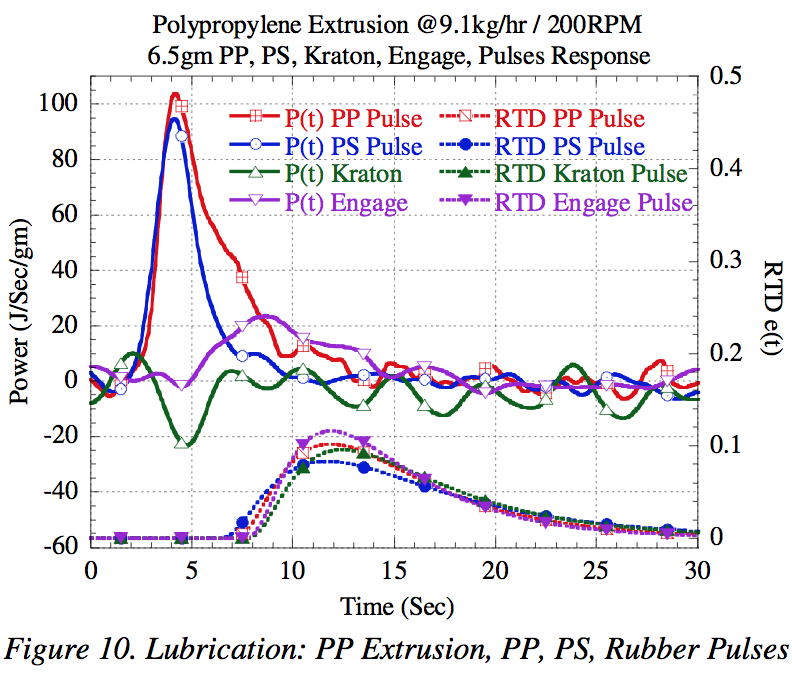
Lubricated Melting
In blends, the concept “of lubricated melting” applies when one component is the continuous, fluid phase and the other ingredients are in a solid suspension. The melting mechanism is governed by viscous dissipation and heat transfer. PP/PS, PP/Rubber and PS/Rubber blends were studied. Fig 10 shows a PP extrusion pulsed with PP, PS, EP and SBS rubbers. While the RTD’s remain the same, the rubber pulses introduce a dramatic change in the power profile. Since the rubbers fuse and flow at low temperatures consuming little energy input, the compaction/deformation peak is lost or retarded by the rubber-rich mixture. This indicates that the begin- ning of the melting zone has transitioned to a viscous flow regime. The SBS rubber pulse caused a large drop in power at the same PP and PS pulse 4.5s peak time. A melting peak was not observed. The EP rubber exhibited a small dip in power at 4.5s, but a delayed and reduced melting peak was observed. We propose that the lubricated melting mechanism occurs, suppressing the high-energy consumption attributed to compaction/friction and deformation. Melting may not be completed when material exits the melting zone as measured by the RTD.
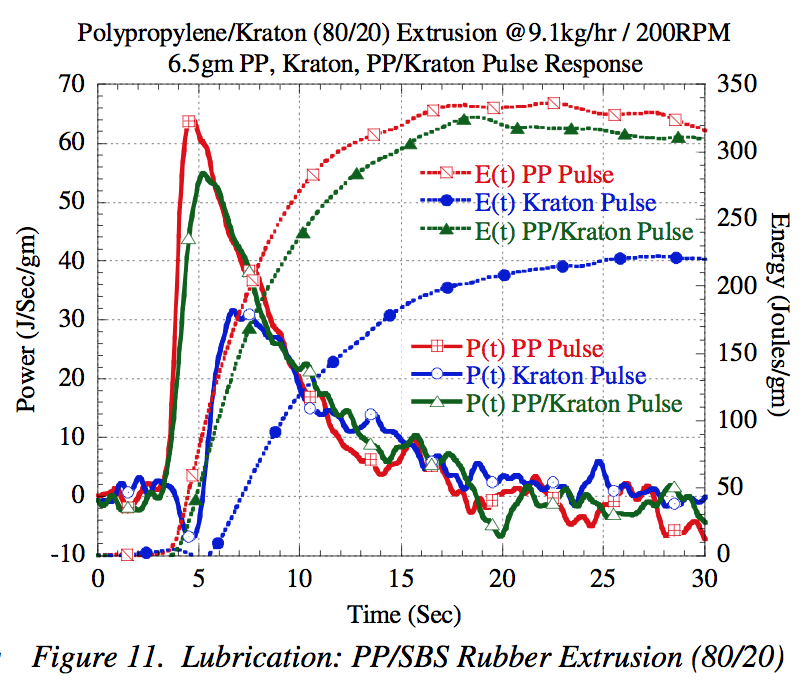
PP/Rubber blend (80/20) extrusions were pulsed with PP , rubber and the 80/20 blend. Fig 11 shows PP , SBS and PP/SBS pulse power and specific energy input responses. Compared with a PP extrusion, the PP pulse shape was the same, but the peak was reduced from 110J/s/gm to 65J/s/gm (PP/SBS) and 85J/s/gm (PP/EP), energy input is reduced from 400J/gm to 330J/gm (PP/SBS) and 370J/gm (PP/EP), while t
M1/2 is increased from 5.5-6.7s (PP/SBS) and 5.9s (PP/EP). These are indications of lubricated melting. SBS and EP rubber pulses had similar responses, with delayed, reduced peaks at 6-8s that start to decay before the materials reach the last reverse element at 9s. The lubrication mechanism was not introduced by the pulse material, but the rubber rich mixture further delayed PP melting. When the (80/20) pulses were added, the composition was not disturbed and the power profiles reflected a mass disturbance only. The pulse test showed material property differences between the SBS and EP rubbers in the PP extrusion including thermal and rheological characteristics of the rubbers and compatibility/miscibility with the matrix resin.
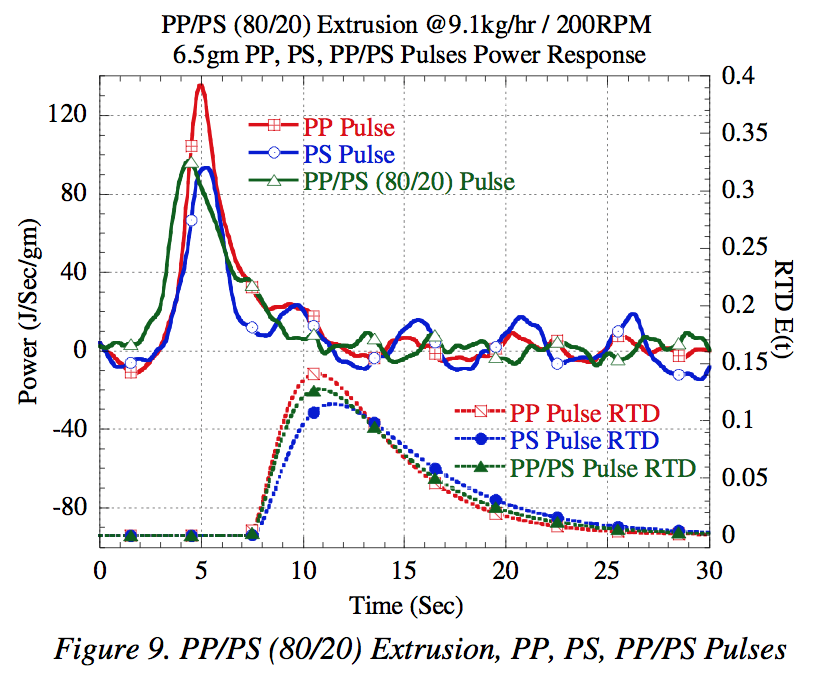
Melting of PP/PS Blends
Melting of semi-crystalline and amorphous polymer blends were described and differences in pellet size, compressive stress-strain, thermal and rheological prop- erties were examined in [7, 8]. The melting steps for binary blends are the same as the single polymer system, but transitions were influenced by the component that melted first. Fig 9 shows power and RTD responses of PP, PS and PP/PS blend pulses during a PP/PS (80/20) blend extrusion. The 0.5gm RTD tracer used the same 80/20 blend. The pulse responses of 80/20 plastic/plastic blends were very different from those observed with the plastic/rubber blends. The lubrication effect in the plastic/rubber system was not evident.
It is important to note that the selection of the pulse composition influences the features revealed in the power response. The rubber pulses in PP extrusion introduced a dramatic change in the melting sequence illuminating the time and intensity effects of the short compaction/deformation region and the bulk of the melting zone KB’s and reverse pumping elements. In the PP/PS blends, the pulse response shows the effects of steady-state composition when perturbed by PP, PS or the PP/PS blend.
Melting in a Batch Mixer
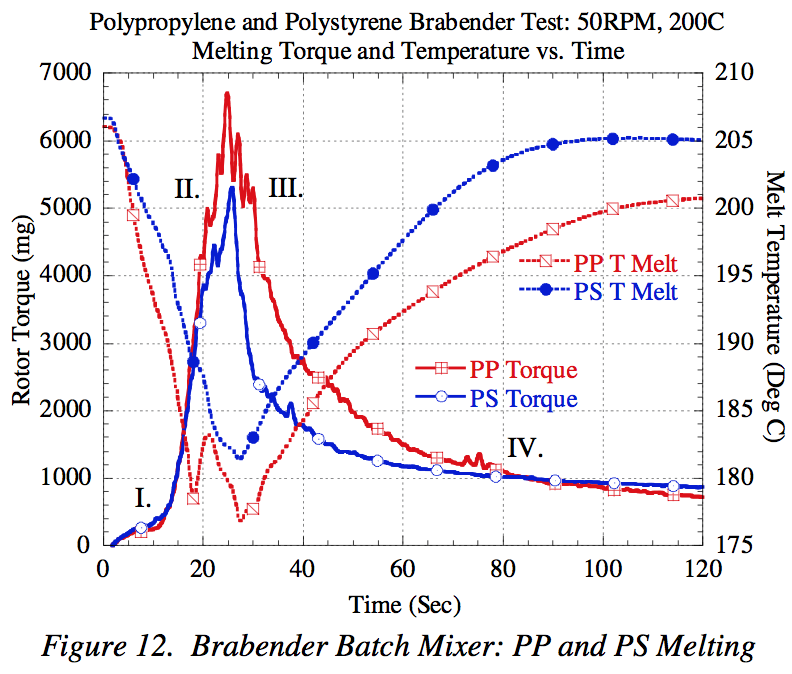
The inspiration for the pulse technique arose from the need to link the stages of melting identified in a batch mixer [3] with the physical transformations in a T/S extruder. Fig 12 shows torque and melt temperature profiles for PP and PS. The melting stages as visualized are: I) compaction of the solids, II) deformation and formation of a melt phase, III) transition to viscoelastic flow of melt phase with unmelted solids, and IV) phase transition complete and viscous melt flow. The shape of the torque curves are very similar to pulse power response in the extruder, with a rapid rise, sharp peak and extended de- cay to the melt flow state on relative time scales. Furthermore, the differences between the PP and PS torque curves are very similar to the pulse profiles. PP and PS have the same compaction region energy consumption, similar rate of torque rise and peak time. The PS peak is less than PS decays more rapidly to the steady state level than PP. This is a strong indication that the pulse response and melting in the extruder can be linked to the batch mixer. Furthermore, the pressure and temperature profiles described in [6, 7] are consistent with the pulse melting response and Brabender torque/temperature pro- files.
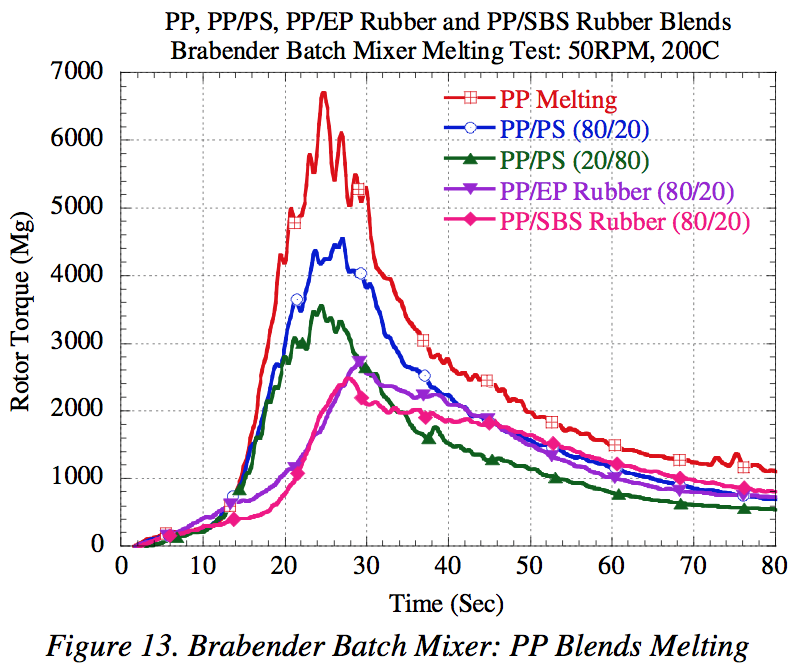
Fig 13 shows the batch mixer melting torque curves for PP, PP/PS (80/20), PP/PS (20/80), PP/EP rubber (80/20) and PP/SBS rubber (80/20) blends. In the batch mixer PS concentration reduced the torque peak while in the extruder, a 20/80 blend pulse peak was increased. This warrants further investigation. In the PP/EP and SBS Rubber blend systems, the batch mixer torque responses were consistent with the pulse response, exhibit- ing delayed peaks at reduced levels. A pronounced shoulder was present after the peak. For the 80/20 PP/EP rubber blend the 2660 mg torque peak occurred at 29s and the shoulder persisted for 10s, while the PP/SBS 2450mg peak was at 28s and the shoulder lasted for 17s. Phase inversion was observed in the 80/20 blends. We hypothesize that the torque shoulders in the batch mixer and the delayed power peaks in the pulse response reflect the delayed melting of PP and provide information about the phase inversion during melting. The batch mixer rubber blend melting process appears to be similar to that in the T/S extruder and the pulse curves can be linked to the torque profiles.
Conclusions
An on-line experimental approach to quantify melting dynamics in T/S melt extrusion has been introduced that uses a novel perturbation method, the pulse technique, integrated with a specialized data acquisition and analysis system, EPAS. Analysis of the T/S functions of solid conveying, compaction, melting and viscous flow has been demonstrated using this method. For PP and PS systems using a standard melting zone design, pulse response power signatures were established as a function of operating condition. The pulse test and analysis can be done on-line during steady state extrusion.
The RTD of the perturbed melting zone has been characterized using the optical probe and TiO2 tracer method during the pulse test. The RTD is insensitive to the amount of the pulse material, indicating that the melting transition is not changed. All trends in the RTD as a function of Q/N follow those of a liquid flow zone. At the same Q/N, subtle differences in the RTD width were detected in the pulse responses between PP, PS and blend extrusions. No significant changes in the RTD were found when the PP, PS or blend extrusions were pulsed with different components and combinations.
The proposed four sequential stages of melting have been linked to the pulse power response, visualization, axial pressure measurements and batch mixer experiments. The power and RTD profiles enable the assignment of energy dissipation time and intensity to solid conveying, compaction, friction and deformation, transition and viscoelastic flows.
A “lubricated melting” mechanism is proposed for the PP/Rubber and PS/Rubber (80/20) blend systems using an Ethylene copolymer and SBS block copolymer as the minor phase component. The effect of the lubricating rubber is very pronounced. Although solid transport time is similar to the PP and PS extrusions, the intensity and the elapsed time of the dissipation peak are significantly different, with reduced peak height, delayed peak time and extended decay to the baseline. This suggests significantly reduced energy input from compaction, friction and deformation and increased time in the transition and viscoelastic flow regimes. In contrast to the rubber blends, the PP/PS (80/20 and 20/80) systems exhibit sharply increased peak heights with same elapsed time of the dissipation peak in the pulse response compared to the single component systems.
This work represents the beginning of an in-depth understanding of the various screw functions during T/S extrusion. Many questions regarding the details of the melting mechanism are yet to be investigated. This method has enormous potential to provide tools for rapid material and process characterization, scale-up and optimization.
Nomenclature
Q/N = Throughput/Screw Speed
T
Delay, t
95% = Minimum and 95% residence times
t
Mean, t
Avg = Mean residence time
t
M 1/2 = Characteristic melting half time
t
xport, t
Peak = Pulse power transport and peak times
P(t), E(t) = Power and energy input
References
1) M. Wetzel, C.K. Shih, D. Denelsbeck, S. Latimer, SPE ANTEC Tech. Papers, T18, 3791, 2003.
2) M. D. Wetzel, C.K. Shih, U. Sundararaj, SPE ANTEC Tech. Papers, 3, 3707, 1997.
3) C. K. Shih, D. G. Tynan, D. A. Denelsbeck, Polymer Engineering and Science, Mid-December, 1991, Vol. 31, No. 23, pp. 1670-1673.
4) P. Elkouss, D. Bigio, M. Wetzel, SPE ANTEC Tech. Papers, M21, 333, 2003.
5) C. G. Gogos, M. H. Kim, “Melting Phenomena and Mechanism in Polymer Processing Equipment”, SPE ANTEC 2000.
6) M. D. Wetzel, “Experimental Study of LDPE Melting”, SPE ANTEC Tech. Papers, 2002.
7) H. Chen, U. Sundararaj, K. Nandakumar, M. D. Wetzel, SPE ANTEC Tech. Papers, M21, 110, 2003.
8) B. Qian, C. G. Gogos, B. J. Jeong, D. B. Todd, SPE ANTEC Tech. Papers, W2, 333, 2003.
Keywords
Extrusion, Melting, Polymer Blends, Perturbation, Pulse, Data Acquisition, Dynamic Monitoring
Return to
Best Papers.